
3 UK Stocks Estimated To Be Trading At Discounts Of Up To 26.2%
The United Kingdom's FTSE 100 index has recently experienced a downturn, influenced by weak trade data from China and broader global economic concerns. Amidst these challenges, identifying undervalued stocks can be an opportunity for investors seeking potential value in the market, especially as some companies may be trading at significant discounts relative to their intrinsic worth.
Top 10 Undervalued Stocks Based On Cash Flows In The United Kingdom
| Name | Current Price | Fair Value (Est) | Discount (Est) |
| Yü Group (AIM:YU.) | £17.55 | £34.94 | 49.8% |
| Strix Group (AIM:KETL) | £0.343 | £0.13 | -156.1% |
| Playtech (LSE:PTEC) | £3.674 | £7.30 | 49.7% |
| On the Beach Group (LSE:OTB) | £1.898 | £3.68 | 48.4% |
| Next 15 Group (AIM:NFG) | £3.27 | £6.17 | 47% |
| Eurocell (LSE:ECEL) | £1.18 | £2.23 | 47.1% |
| Entain (LSE:ENT) | £5.45 | £10.47 | 48% |
| Diaceutics (AIM:DXRX) | £1.53 | £2.89 | 47.1% |
| Coats Group (LSE:COA) | £0.8645 | £1.64 | 47.4% |
| AstraZeneca (LSE:AZN) | £118.96 | £223.63 | 46.8% |
Let's take a closer look at a couple of our picks from the screened companies.
Cerillion (AIM:CER)
Overview: Cerillion Plc provides software solutions for billing, charging, and customer relationship management to the telecommunications industry across various regions including the United Kingdom, Europe, the Middle East and Africa, the Americas, and the Asia Pacific with a market cap of £278.86 million.
Operations: The company's revenue is primarily derived from its software segment, generating £22.57 million, and its services segment, contributing £17.84 million.
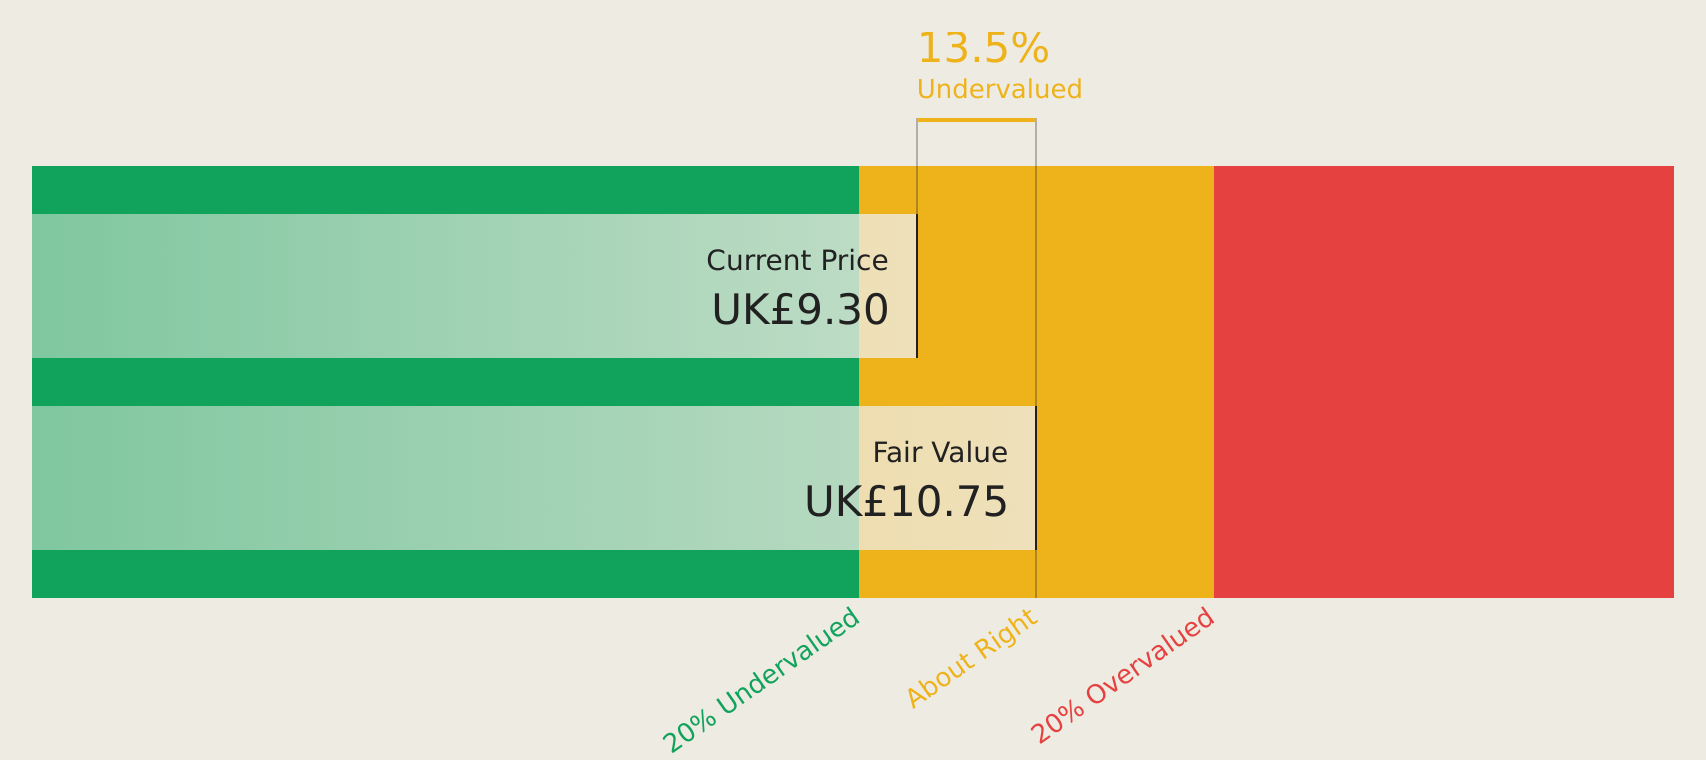
Estimated Discount To Fair Value: 12.1%
Cerillion is trading at £9.44, below its estimated future cash flow value of £10.74, indicating potential undervaluation based on cash flows. Despite a decline in sales and net income for the half-year ending March 2026, Cerillion's earnings are forecast to grow faster than the UK market at 15.3% annually. The company recently increased its interim dividend by 15%, reflecting confidence in future cash flow generation despite current financial challenges.
- The growth report we've compiled suggests that Cerillion's future prospects could be on the up.
- Click here and access our complete balance sheet health report to understand the dynamics of Cerillion.
Brooks Macdonald Group (LSE:BRK)
Overview: Brooks Macdonald Group plc offers wealth management and financial planning services to private individuals, trusts, charities, and pension funds in the United Kingdom, with a market cap of £218.59 million.
Operations: The company's revenue primarily comes from its UK Investment Management segment, which includes financial planning, amounting to £117.92 million.
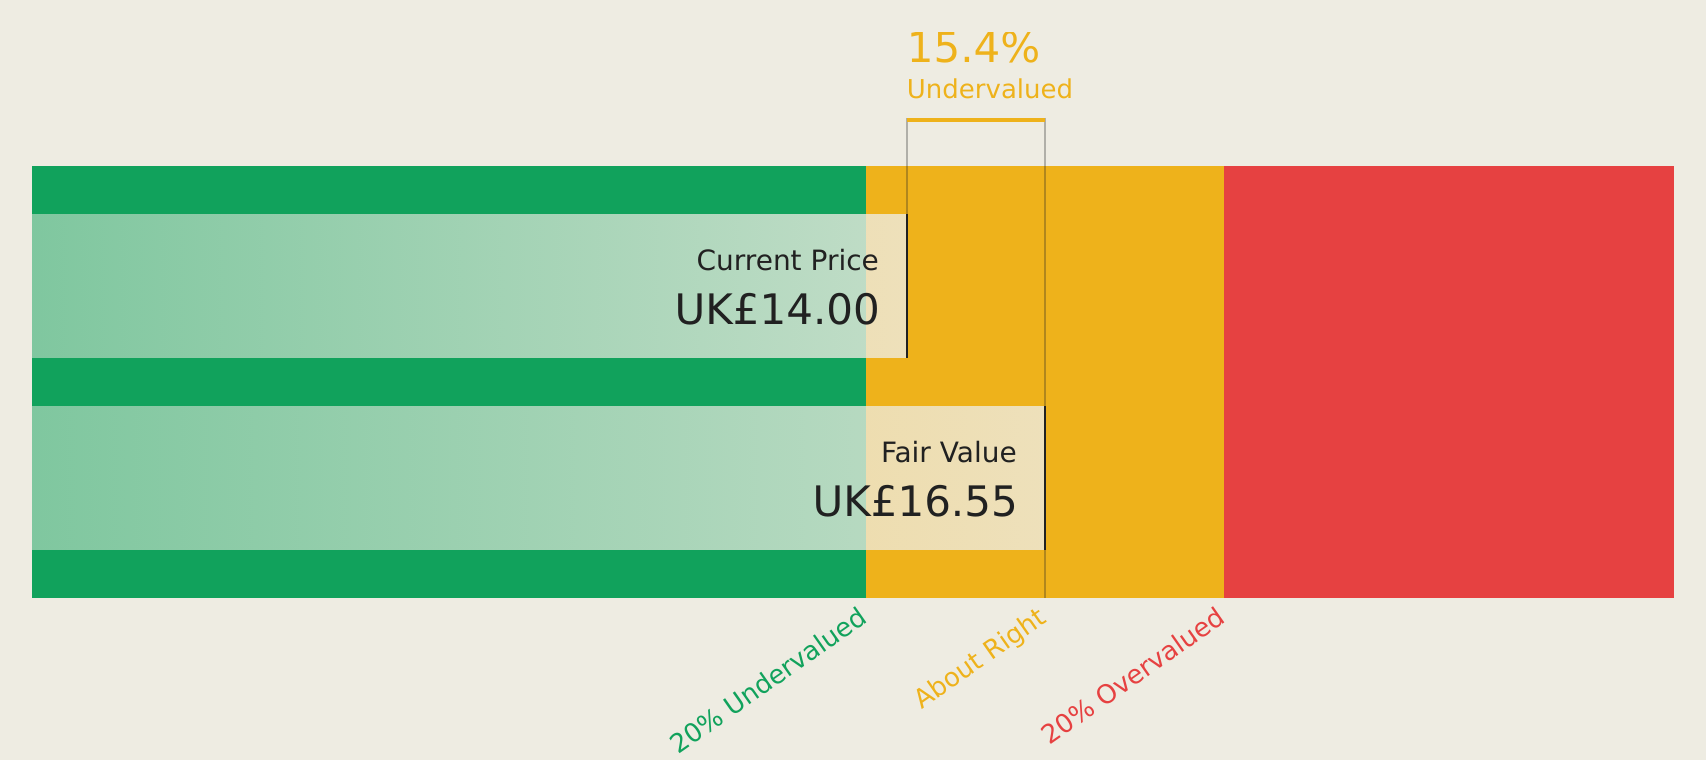
Estimated Discount To Fair Value: 14.5%
Brooks Macdonald Group is trading at £14.15, below its estimated future cash flow value of £16.56, suggesting potential undervaluation. The company forecasts significant earnings growth at 32.8% annually, outpacing the UK market's average. However, profit margins have declined from last year and dividends are not well covered by earnings or free cash flows. Recent acquisitions have expanded assets under advice to £5.7 billion, with further acquisitions considered to enhance growth prospects.
- According our earnings growth report, there's an indication that Brooks Macdonald Group might be ready to expand.
- Dive into the specifics of Brooks Macdonald Group here with our thorough financial health report.
CAB Payments Holdings (LSE:CABP)
Overview: CAB Payments Holdings plc operates in the business-to-business cross-border payments and foreign exchange services sector across various regions including the Americas, Europe, Africa, the Middle East, and Asia, with a market capitalization of approximately £205.63 million.
Operations: CAB Payments Holdings plc generates revenue through its business-to-business cross-border payments and foreign exchange services across the Americas, United Kingdom, Europe, Africa, Middle East, and Asia.
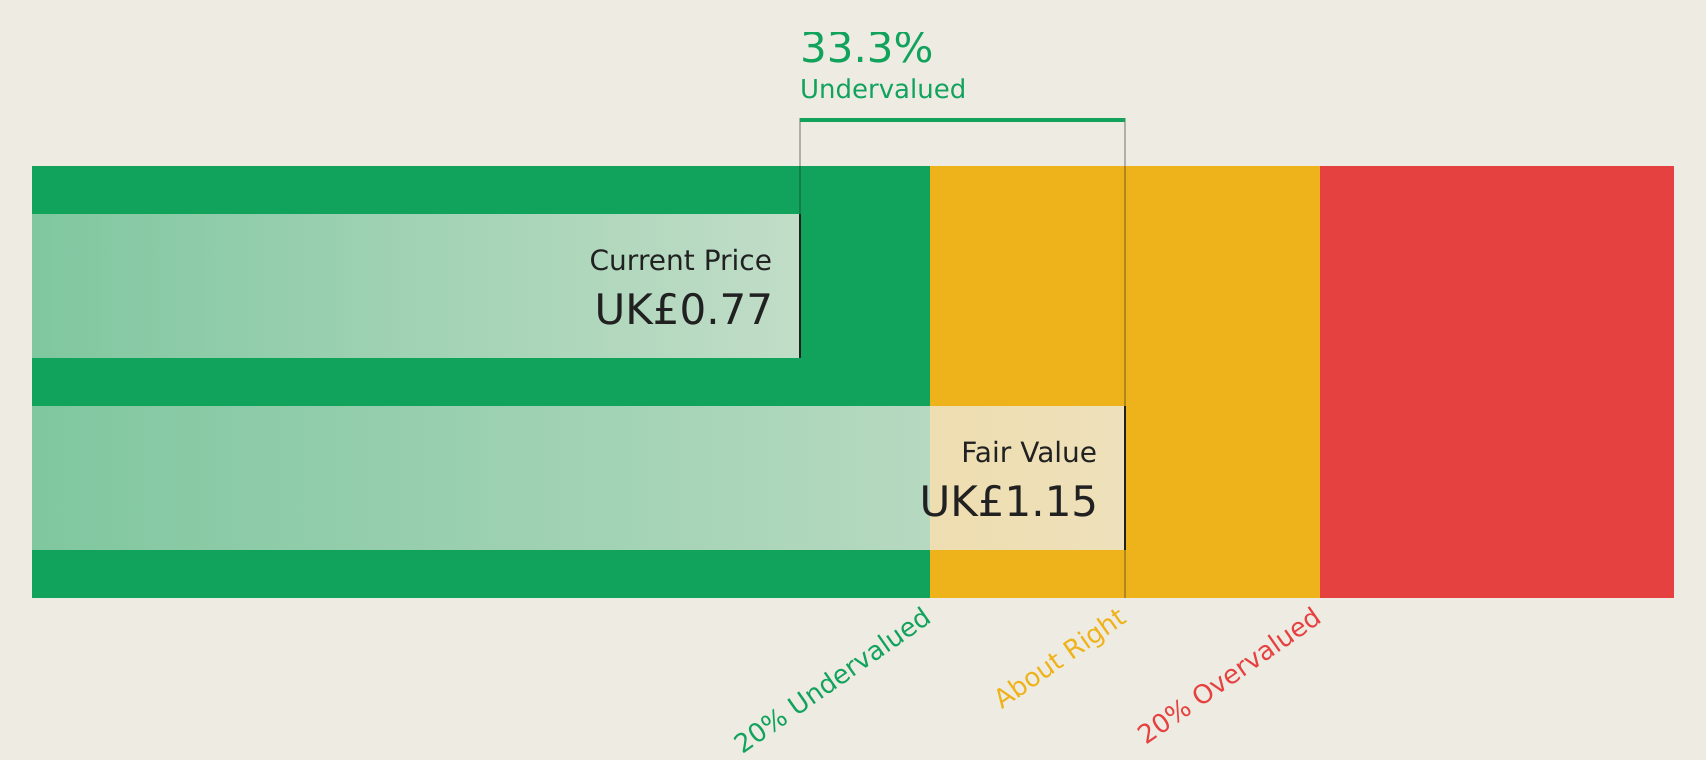
Estimated Discount To Fair Value: 26.2%
CAB Payments Holdings is trading at £0.81, below its future cash flow value of £1.1, indicating potential undervaluation. The company forecasts earnings growth of 20.2% annually, surpassing the UK market average. Recent financial results show net income increased to £9.49 million for H1 2026 from £2.3 million last year, and a dividend was initiated at 2.1 pence per share, reflecting strong cash flow management despite leadership changes and acquisition considerations underway.
- Our comprehensive growth report raises the possibility that CAB Payments Holdings is poised for substantial financial growth.
- Delve into the full analysis health report here for a deeper understanding of CAB Payments Holdings.
Taking Advantage
- Investigate our full lineup of 46 Undervalued UK Stocks Based On Cash Flows right here.
- Hold shares in these firms? Setup your portfolio in Simply Wall St to seamlessly track your investments and receive personalized updates on your portfolio's performance.
- Simply Wall St is your key to unlocking global market trends, a free user-friendly app for forward-thinking investors.
Contemplating Other Strategies?
- Explore high-performing small cap companies that haven't yet garnered significant analyst attention.
- Diversify your portfolio with solid dividend payers offering reliable income streams to weather potential market turbulence.
- Fuel your portfolio with companies showing strong growth potential, backed by optimistic outlooks both from analysts and management.
This article by Simply Wall St is general in nature. We provide commentary based on historical data and analyst forecasts only using an unbiased methodology and our articles are not intended to be financial advice. It does not constitute a recommendation to buy or sell any stock, and does not take account of your objectives, or your financial situation. We aim to bring you long-term focused analysis driven by fundamental data. Note that our analysis may not factor in the latest price-sensitive company announcements or qualitative material. Simply Wall St has no position in any stocks mentioned.
Have feedback on this article? Concerned about the content? Get in touch with us directly. Alternatively, email editorial-team@simplywallst.com