
Dai-Dan (TSE:1980) Faces A Fresh Valuation Test As Earnings And Dividend Guidance Shift
What Dai-Dan’s latest earnings and dividend guidance mean for investors
Dai-Dan (TSE:1980) has drawn attention after reporting first quarter earnings, issuing full year guidance to March 2027, and outlining lower dividend payments compared with the previous year’s levels.
The update combines modest sales growth with slightly softer profitability and a step down in dividend guidance, including second quarter expectations following a recent 3 for 1 stock split.
See our latest analysis for Dai-Dan.
Alongside the dividend and guidance updates released on 5 August 2026, Dai-Dan’s share price has moved from short term weakness to renewed interest, with a 30 day share price return that is down 8.5%, a 90 day share price return that is down 16.4%, a 1 year total shareholder return of 38.1%, and a very large 5 year total shareholder return above 6x, which suggests long term holders have still seen strong overall gains despite recent volatility.
If Dai-Dan’s recent moves have you rethinking where opportunities might be next, it can be useful to broaden your watchlist and check out 37 power grid technology and infrastructure stocks
Dai-Dan now trades at a sizeable discount to analyst targets and an indicated intrinsic value, even after the dividend step down. Is the market rightly cautious about earnings quality and payouts, or is it marking the stock down too far?
Price-to-Earnings of 12.4x: Is it justified for Dai-Dan?
Dai-Dan currently trades on a P/E of 12.4x, which sits above both its peer group and the wider Japan construction industry even though the stock price is ¥2,538.
The P/E ratio compares the current share price to earnings per share, so it reflects how much investors are willing to pay for each unit of current profit. For a contractor like Dai-Dan, this often links to how confident the market feels about the quality and durability of those earnings rather than just short term growth.
Simply Wall St’s fair P/E estimate for Dai-Dan is 19.6x, which is materially higher than the current 12.4x level. Against that benchmark, the market is assigning a lower multiple than the regression based fair ratio, even as Dai-Dan screens as more expensive than peers on a simple P/E comparison. Within the Japan construction industry, the stock’s 12.4x P/E is above both the direct peer average of 11.5x and the broader industry average of 10.7x, which shows investors are still paying a premium versus domestic contractors.
Explore the SWS fair ratio for Dai-Dan
Result: Price-to-Earnings of 12.4x (ABOUT RIGHT)
However, Dai-Dan still faces risks if earnings quality disappoints or if the lower dividend guidance signals a longer period of more cautious cash returns.
Find out about the key risks to this Dai-Dan narrative.
Another view on Dai-Dan’s valuation
The P/E discussion paints Dai-Dan as slightly expensive against peers, yet the SWS DCF model tells a different story. At a share price of ¥2,538 and an estimated future cash flow value of ¥3,522.19, the stock screens as undervalued by 27.9%. That raises a clear question: Is the cash flow picture more reliable than the earnings multiple?
Look into how the SWS DCF model arrives at its fair value.
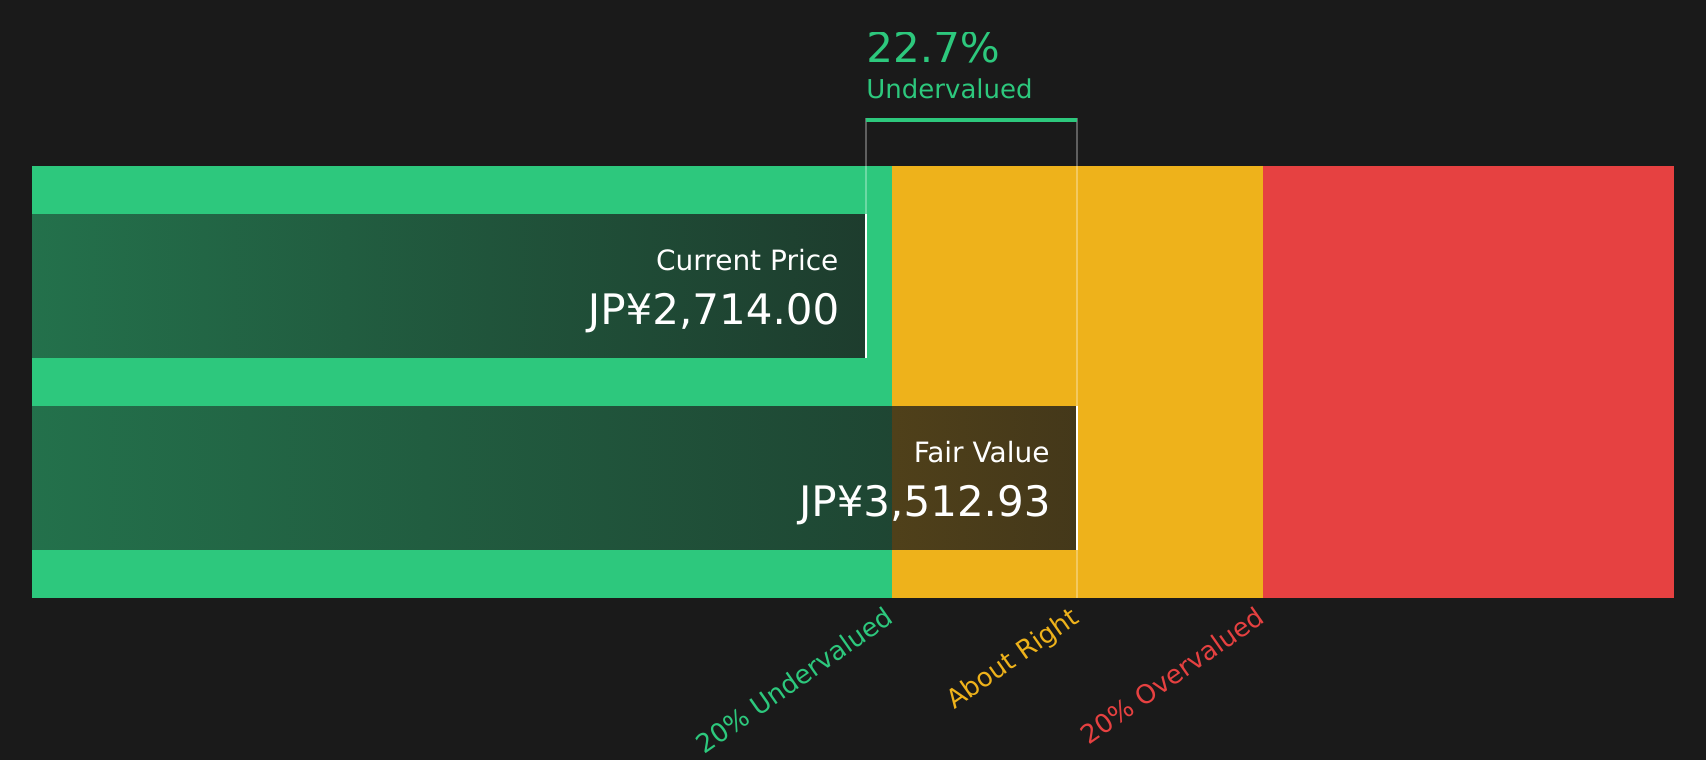
Simply Wall St performs a discounted cash flow (DCF) on every stock in the world every day (check out Dai-Dan for example). We show the entire calculation in full. You can track the result in your watchlist or portfolio and be alerted when this changes, or use our stock screener to discover 19 high quality undervalued stocks. If you save a screener we even alert you when new companies match - so you never miss a potential opportunity.
Next Steps
The mix of potential risks and possible rewards around Dai-Dan will not feel the same to every investor, so it helps to move quickly and review the underlying data yourself to build confidence in your stance. You can start by weighing the 3 key rewards and 2 important warning signs.
Looking for more Dai-Dan investment ideas beyond this stock?
If you stop with Dai-Dan, you could miss other opportunities that fit your style. Take a few minutes to scan focused shortlists built from the same data engine.
- Target potential upside in quality companies that look mispriced today by reviewing the 19 high quality undervalued stocks.
- Prioritise resilience and capital protection by using the 55 resilient stocks with low risk scores to spot stocks with steadier risk profiles.
- Get ahead of the crowd by scanning the screener containing 64 high quality undiscovered gems before other investors pay closer attention.
This article by Simply Wall St is general in nature. We provide commentary based on historical data and analyst forecasts only using an unbiased methodology and our articles are not intended to be financial advice. It does not constitute a recommendation to buy or sell any stock, and does not take account of your objectives, or your financial situation. We aim to bring you long-term focused analysis driven by fundamental data. Note that our analysis may not factor in the latest price-sensitive company announcements or qualitative material. Simply Wall St has no position in any stocks mentioned.
Have feedback on this article? Concerned about the content? Get in touch with us directly. Alternatively, email editorial-team@simplywallst.com