
Is Enterprise Financial Services (EFSC) A Bargain Or Fully Priced Following Its Recent Pullback?
Why Enterprise Financial Services stock is on investor radar today
Enterprise Financial Services (EFSC) moved in Tuesday trading with a modest daily decline of 0.3% and a weekly fall of 1.7%, keeping the stock in focus for investors tracking recent price swings.
See our latest analysis for Enterprise Financial Services.
Looking beyond the latest move, Enterprise Financial Services has shown firm momentum, with a 90 day share price return of 11.19% and a year to date share price return of 21.52%. The 3 year total shareholder return of 71.84% and 5 year total shareholder return of 57.63% suggest that investors who stayed invested have seen materially stronger outcomes over time.
If this kind of steady banking stock interests you, it can be useful to widen the search to other financially resilient businesses and check out the 19 top founder-led companies
After the recent pullback and strong longer term returns, some investors will wonder whether to wait for a deeper dip in Enterprise Financial Services or accept today’s price as reasonable value. The next step is to test that idea against the current valuation.
Price-to-earnings of 12.7x: Is it justified for Enterprise Financial Services?
On a simple earnings lens, Enterprise Financial Services trades on a P/E of 12.7x, which sits below the peer average of 14x but slightly above the wider US banks average of 12x.
The P/E ratio compares the company’s share price to its earnings per share. For a bank like Enterprise Financial Services, it is a quick way to see how the market is valuing its profit stream relative to similar companies. A lower P/E than close peers can point to a lower valuation being placed on each dollar of earnings, even if the business outlook appears comparable.
EFSC is described as good value against its peer group based on this 12.7x P/E compared to the 14x average, yet it is also flagged as slightly expensive relative to the broader US banks industry at 12x and to an estimated fair P/E of 12.6x that our models suggest may be appropriate.
Explore the SWS fair ratio for Enterprise Financial Services
Result: Preferred multiple of price-to-earnings of 12.7x (ABOUT RIGHT)
However, Enterprise Financial Services still faces risks, such as credit quality pressure in its lending book and shifts in US regional economic conditions that could unsettle the current valuation story.
Find out about the key risks to this Enterprise Financial Services narrative.
Another view on Enterprise Financial Services valuation
While the 12.7x P/E suggests Enterprise Financial Services is roughly in line with an estimated fair ratio of 12.6x, our DCF model points to a different perspective. On that measure, EFSC at $65.68 is below an estimated future cash flow value of $102.70. Which signal do you consider more informative?
Look into how the SWS DCF model arrives at its fair value.
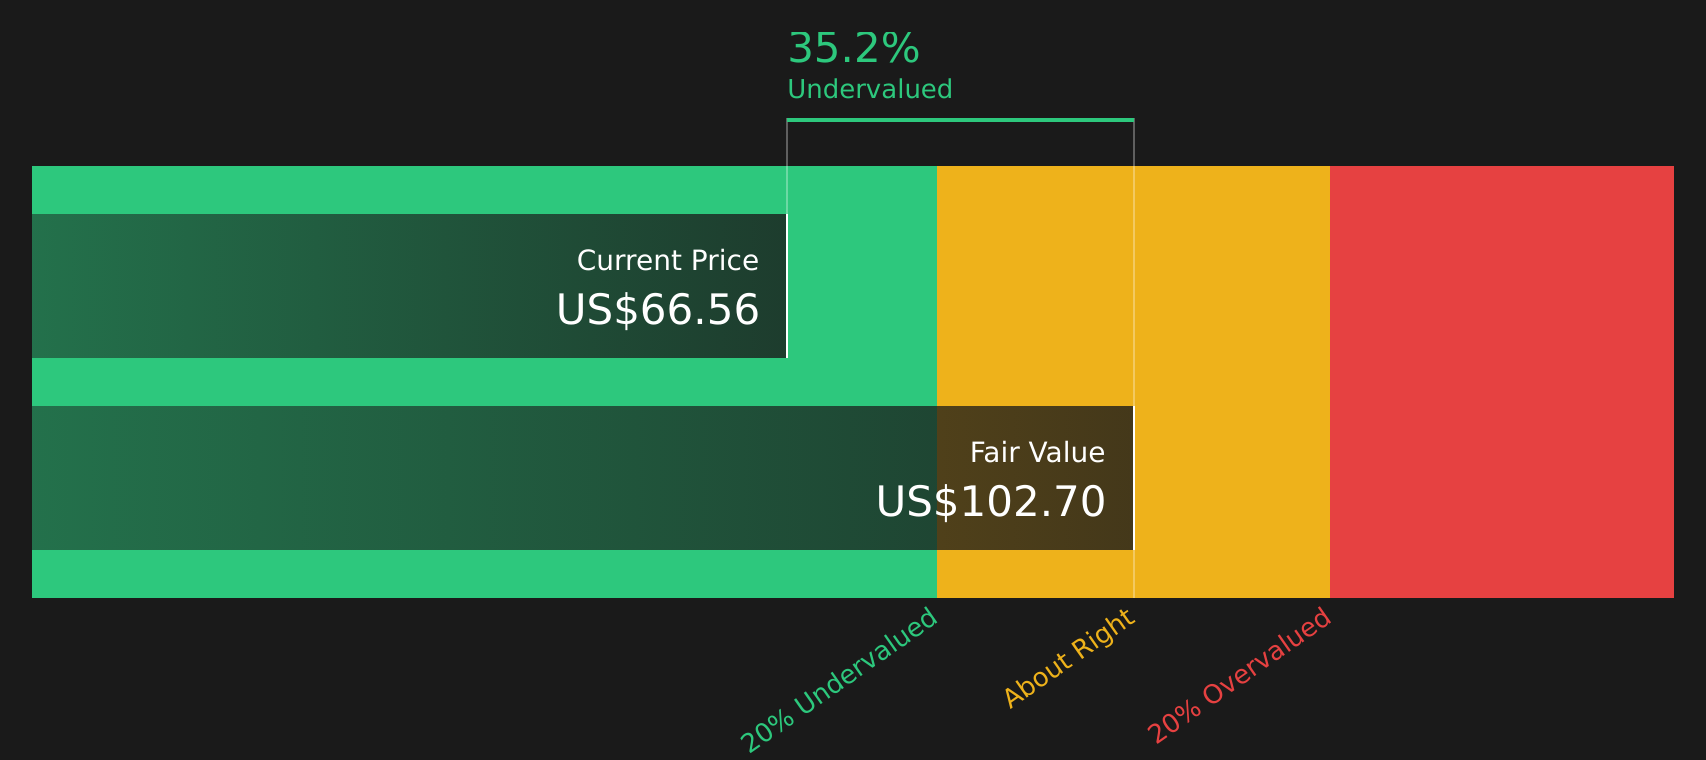
Simply Wall St performs a discounted cash flow (DCF) on every stock in the world every day (check out Enterprise Financial Services for example). We show the entire calculation in full. You can track the result in your watchlist or portfolio and be alerted when this changes, or use our stock screener to discover 51 high quality undervalued stocks. If you save a screener we even alert you when new companies match - so you never miss a potential opportunity.
Next Steps
If this mixed but constructive tone around Enterprise Financial Services has you thinking, now is a good time to review the numbers yourself and decide where you stand. To see what optimistic factors our data highlights, take a closer look at the 3 key rewards.
Looking for more investment ideas beyond Enterprise Financial Services?
If Enterprise Financial Services has sharpened your interest, do not stop with one stock. Use targeted stock lists to uncover new opportunities that might fit your approach.
- Spot potential upside by scanning 51 high quality undervalued stocks that combine solid fundamentals with prices that may sit below what the financials suggest.
- Strengthen your income stream by reviewing 9 dividend fortresses that offer higher yields while still focusing on resilience.
- Protect your downside by filtering for 83 resilient stocks with low risk scores that score well on stability and balance sheet strength.
This article by Simply Wall St is general in nature. We provide commentary based on historical data and analyst forecasts only using an unbiased methodology and our articles are not intended to be financial advice. It does not constitute a recommendation to buy or sell any stock, and does not take account of your objectives, or your financial situation. We aim to bring you long-term focused analysis driven by fundamental data. Note that our analysis may not factor in the latest price-sensitive company announcements or qualitative material. Simply Wall St has no position in any stocks mentioned.
Have feedback on this article? Concerned about the content? Get in touch with us directly. Alternatively, email editorial-team@simplywallst.com