
Danaos (DAC) Stock Looks Like A Bargain On Fair Value And Earnings
Danaos stock has delivered a strong 5 year return, yet both the Discounted Cash Flow (DCF) intrinsic value estimate and the market multiples currently point to the shares screening as undervalued. With that backdrop, investors are weighing how much of the recent performance and contract visibility is already reflected in the US$138.32 share price.
- Over the past 5 years, Danaos has returned 127.4%, which puts today’s valuation in focus after a solid long term run.
- Long duration charter contracts and a vessel backlog reported at US$4.6b can support cash flow visibility. At the same time, exposure to shipping markets and capital needs for new vessels may still affect how much value investors assign to those future cash flows.
- Across Simply Wall St’s valuation checks, Danaos scores 5 out of 6, which means the broader assessment leans on the cheap side.
The issue now is whether the current discount to the intrinsic value estimate and market multiples offers enough appeal after the share price gains of recent years.
Find out why Danaos' 52.1% return over the last year is lagging behind its peers.
Is Danaos a Bargain on Cash Flow?
The Discounted Cash Flow (DCF) model looks at the cash Danaos can generate for shareholders in the future and brings it back to today’s dollars. For Danaos, the latest twelve month free cash flow is about $192.5 million, and the model assumes that cash flows grow from current levels before easing into a slower phase.
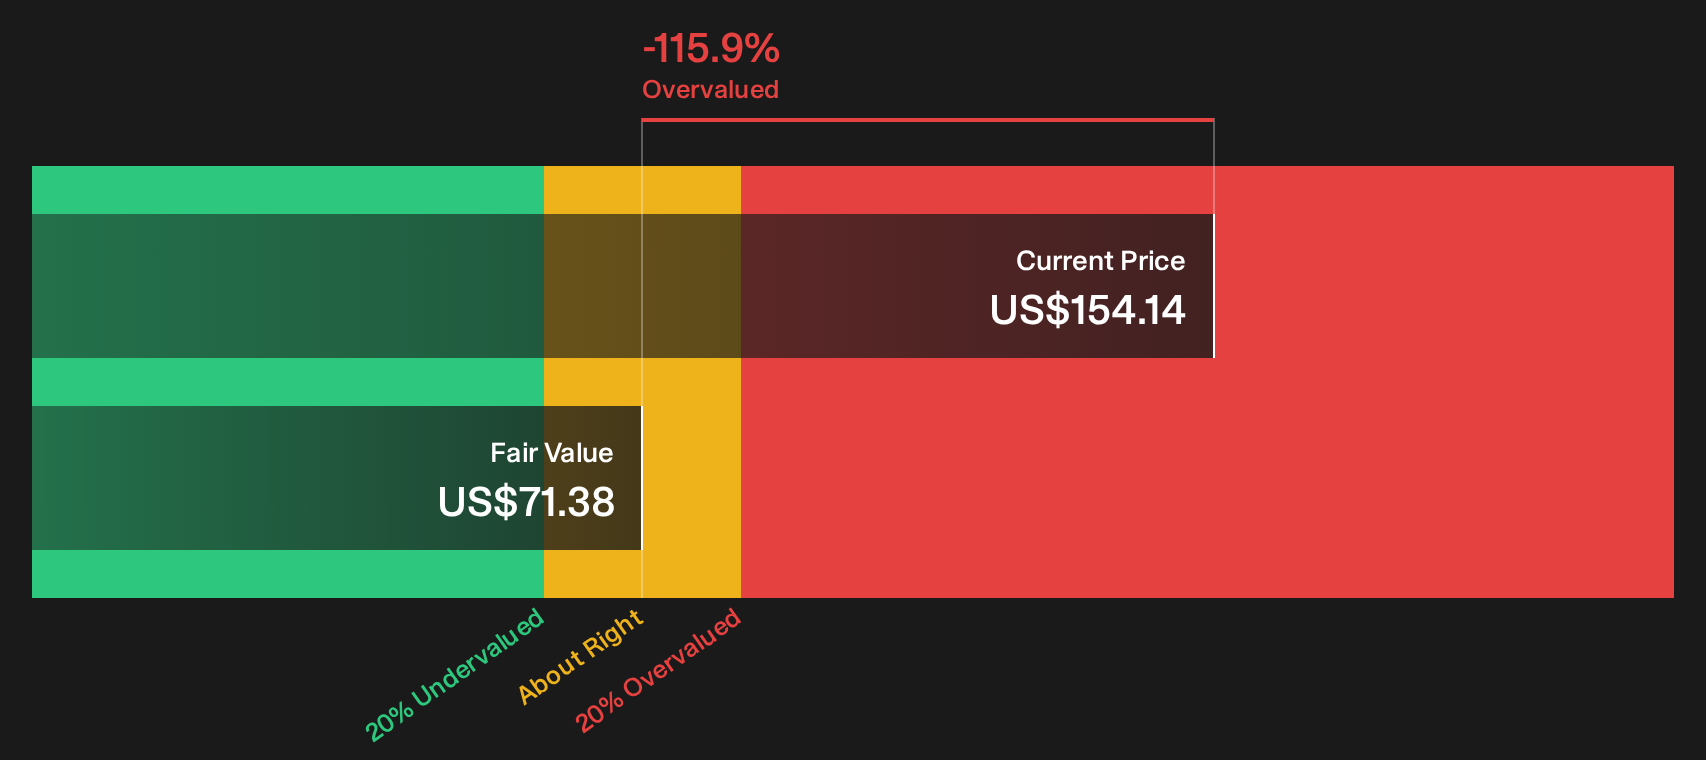
On these inputs, the DCF estimate of intrinsic value comes out at about $271 per share, compared with the recent share price of $138.32. That implies the stock screens around 49.0% undervalued on this cash flow view. The recent announcement of new vessel financing and a $4.6b charter backlog provides additional context for why the model indicates substantial support for those projected cash flows, even though the market is still pricing Danaos well below that estimate.
On this DCF view, Danaos stock currently appears undervalued relative to its projected cash generation.
Our Discounted Cash Flow (DCF) analysis suggests Danaos is undervalued by 49.0%. Track this in your watchlist or portfolio, or discover 51 more high quality undervalued stocks.
Is Danaos a Bargain on Earnings?
The P/E ratio is a useful way to compare Danaos with other shipping companies because earnings remain a key driver of valuation in the sector. On this measure, Danaos trades on a P/E of about 4.7x, which is well below the shipping industry average of 11.0x and the peer average of 13.2x. This places the stock at a sizable discount to what investors are currently paying for earnings across the sector.
The fair P/E ratio for Danaos is estimated at about 11.2x based on its specific profile, which provides a more tailored comparison than a simple industry average. Relative to the current 4.7x multiple, the stock trades materially below that fair level. This indicates the market is assigning a cautious earnings multiple despite the existing charter backlog and recent financing developments.
On the P/E multiple, Danaos stock appears undervalued relative to both peers and its own implied fair earnings ratio.

See what the numbers say about this price — find out in our valuation breakdown.
The Danaos Narrative: What Would Justify Today's Price?
Simply Wall St Narratives for Danaos pick up where the valuation checks leave off by spelling out the specific assumptions about Danaos' future growth, margins and earnings that would need to hold for the stock to be worth materially more or less than today’s price. Instead of giving a single figure from a ratio or model, they describe the future that figure relies on so you can watch how the real business tracks against it on the Community page.
One of the top community narratives on Danaos: 12% undervalued
"Strong contract coverage, disciplined capital allocation, and financial resilience position Danaos for stable growth and sustained margins amid evolving global shipping trends..."
Read one of the top narratives on Danaos
Do you think there's more to the story for Danaos? Head over to our Community to see what others are saying!
The Bottom Line
Danaos screens as undervalued on both the Discounted Cash Flow (DCF) intrinsic value estimate and current earnings multiples, which is a rare level of agreement between cash flow and market based views. The key question is whether the charter backlog and financing structure translate into the cash generation implied by the intrinsic value estimate and a potential re rating of the P/E. For many investors, the crux from here is whether the current discount reflects genuine mispricing or an appropriate cushion for shipping market and capital spending risks.
This article by Simply Wall St is general in nature. We provide commentary based on historical data and analyst forecasts only using an unbiased methodology and our articles are not intended to be financial advice. It does not constitute a recommendation to buy or sell any stock, and does not take account of your objectives, or your financial situation. We aim to bring you long-term focused analysis driven by fundamental data. Note that our analysis may not factor in the latest price-sensitive company announcements or qualitative material. Simply Wall St has no position in any stocks mentioned.
Have feedback on this article? Concerned about the content? Get in touch with us directly. Alternatively, email editorial-team@simplywallst.com