
European Market Insights: Aeta Among 3 Promising Penny Stocks
The European market has recently shown resilience, with the pan-European STOXX Europe 600 Index rising by 1.70% as firmer risk appetite and resilient earnings buoyed investor sentiment. Despite the vintage feel of the term "penny stocks," these smaller or newer companies can still present valuable opportunities for investors seeking to uncover hidden potential in a volatile market landscape. By focusing on financial strength and growth potential, penny stocks offer a unique avenue for investors looking to explore beyond well-known names and discover promising prospects within Europe's diverse economic environment.
We're going to check out a few of the best picks from our screener tool.
Aeta (BVB:ELGS)
Simply Wall St Financial Health Rating: ★★★★☆☆
Overview: Aeta SA is a Romanian company that manufactures and markets consumer electrical goods for industrial manufacturers, with a market capitalization of RON28.30 million.
Operations: The company generates revenue of RON28.59 million from its production segment.
Market Cap: RON28.3M
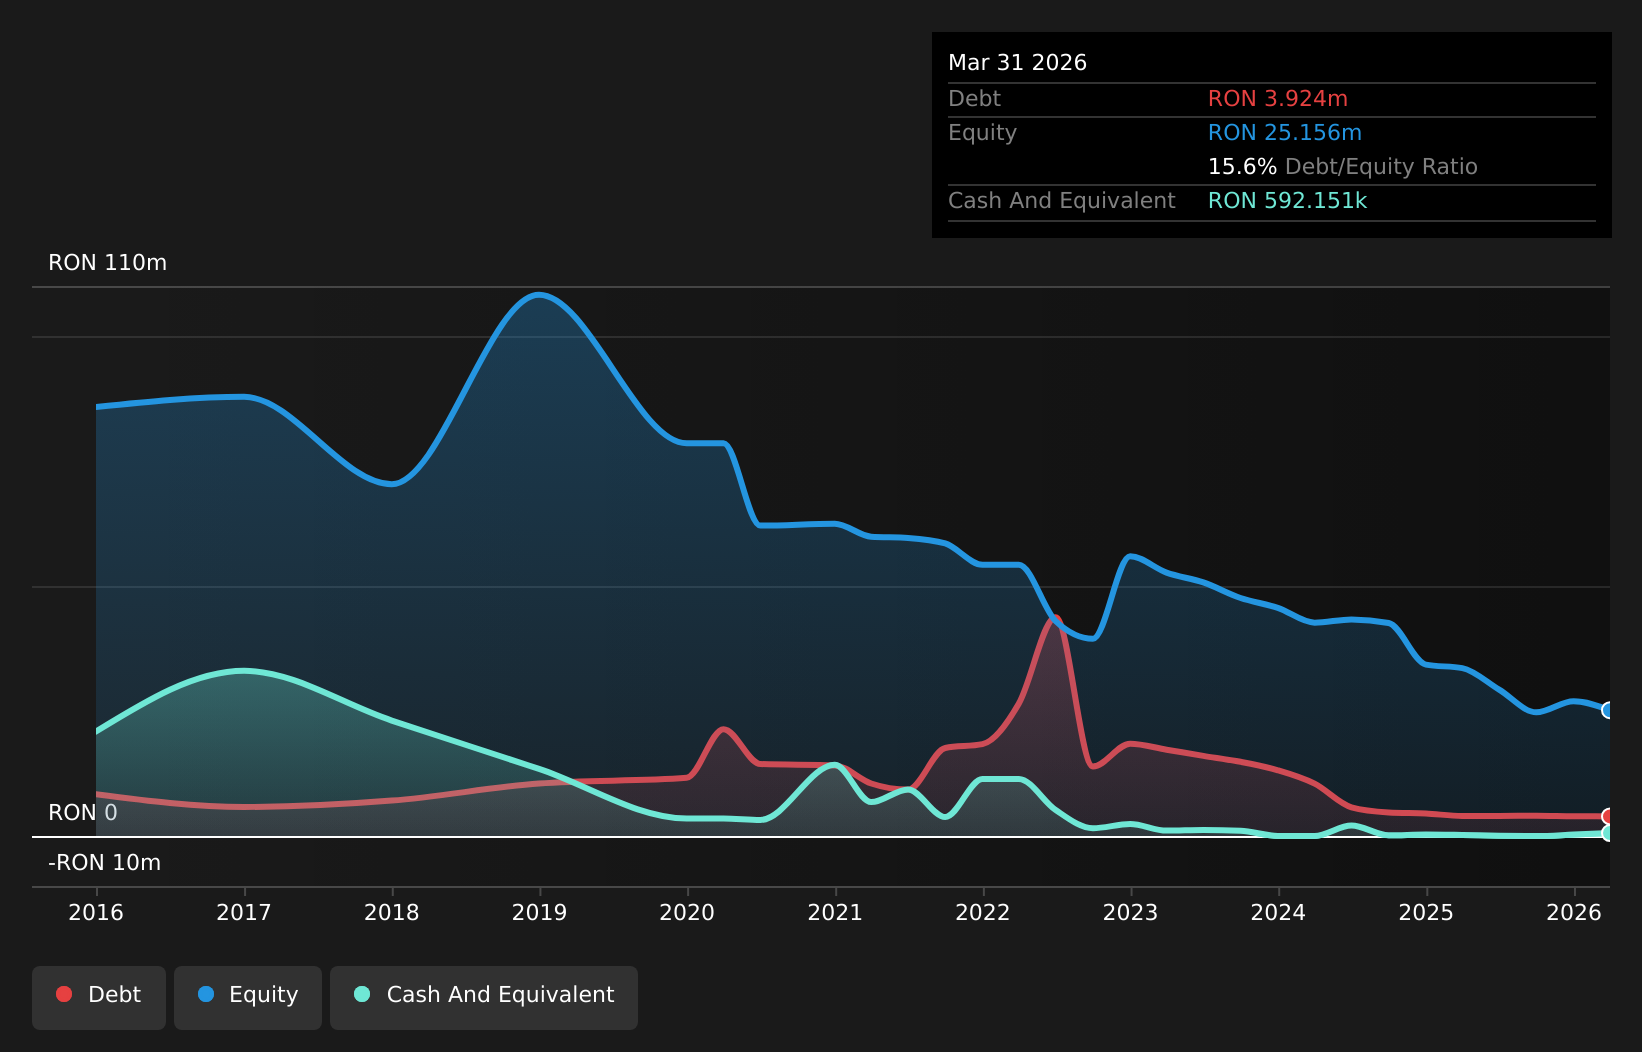
Aeta SA, a Romanian manufacturer of consumer electrical goods, has faced challenges with its recent financial performance. The company reported a significant drop in first-quarter sales to RON0.87 million from RON10.86 million the previous year, alongside an increased net loss of RON1.77 million. Despite being unprofitable, Aeta maintains a positive free cash flow and sufficient cash runway for over three years. Its debt levels are satisfactory with a net debt to equity ratio of 13.2%, though short-term assets do not cover liabilities adequately. The stock has experienced high volatility recently, which is common among penny stocks.
- Take a closer look at Aeta's potential here in our financial health report.
- Review our historical performance report to gain insights into Aeta's track record.
Glaston Oyj Abp (HLSE:GLA1V)
Simply Wall St Financial Health Rating: ★★★★★☆
Overview: Glaston Oyj Abp is a company that manufactures and sells glass processing machines across various regions including Finland, Europe, the Middle East, Africa, the Americas, and the Asia Pacific with a market cap of €46.25 million.
Operations: The company's revenue is primarily derived from its Architecture segment, generating €152.76 million, and its Mobility, Display & Solar segment, contributing €45.78 million.
Market Cap: €46.25M
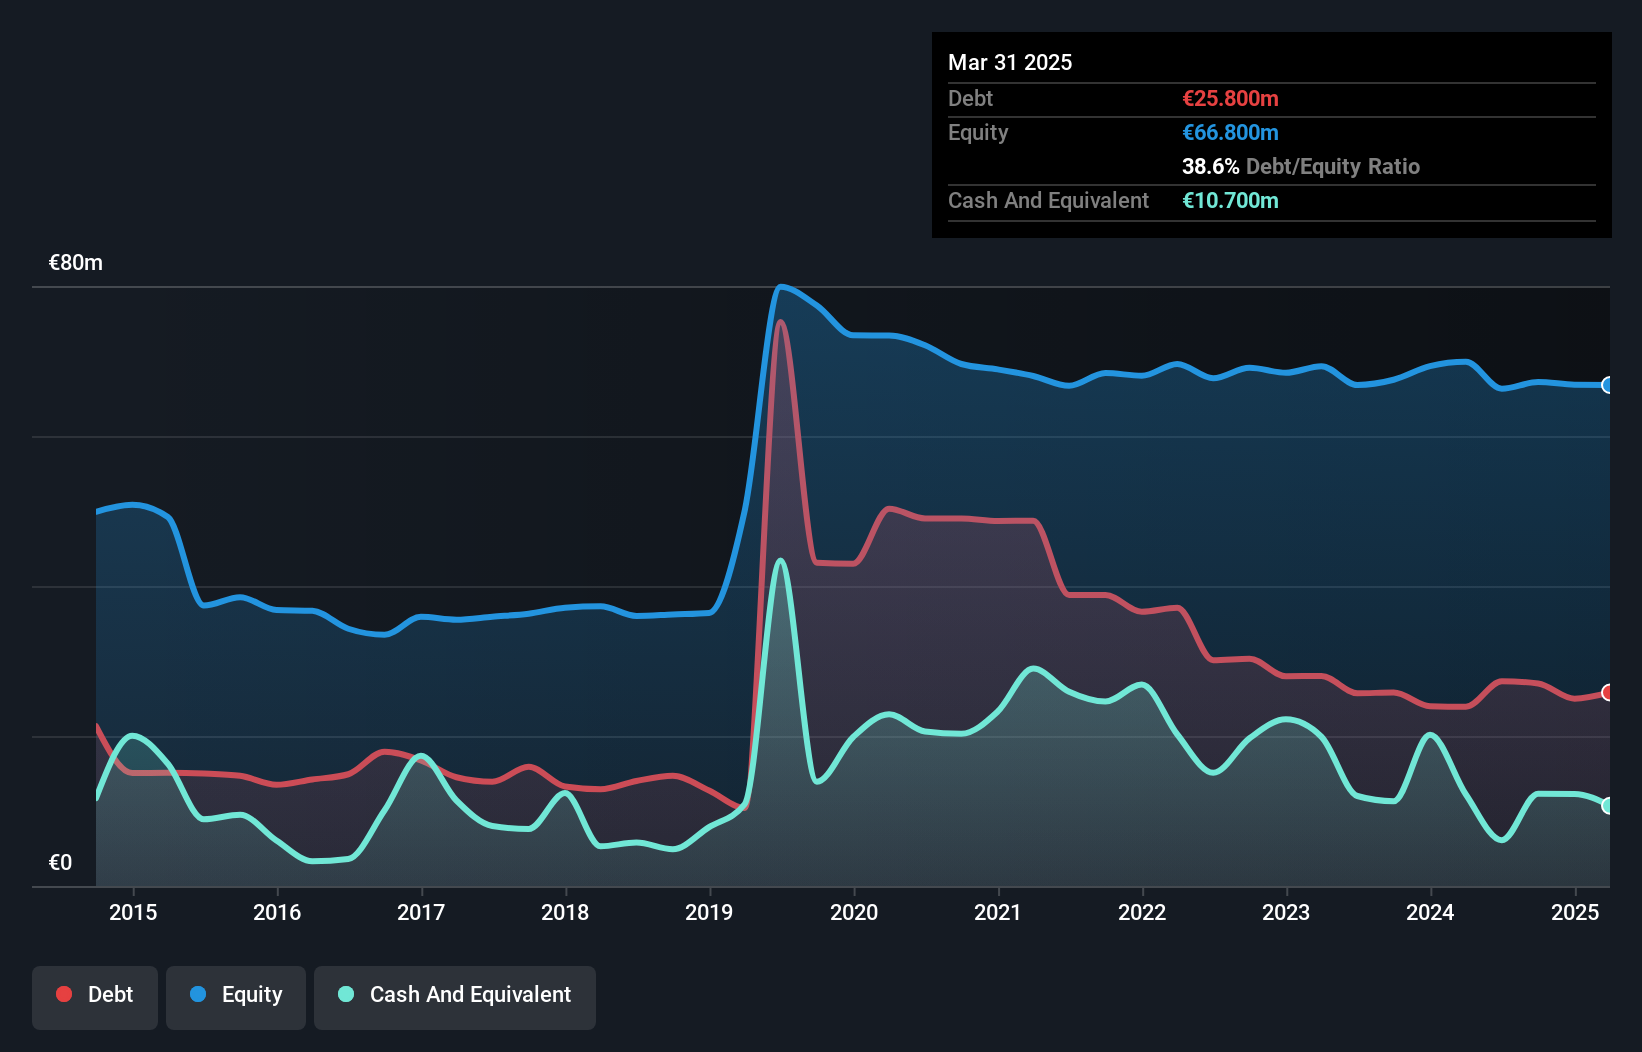
Glaston Oyj Abp, a glass processing machine manufacturer, operates with a market cap of €46.25 million and has shown resilience in the penny stock realm. The company derives substantial revenue from its Architecture segment (€152.76 million) and Mobility, Display & Solar segment (€45.78 million). While its Return on Equity is low at 2.6%, Glaston maintains high-quality earnings and reduced its debt to equity ratio from 71.6% to 48.9% over five years, indicating improved financial health. Recent restructuring aims to enhance customer focus by dividing EMEA + APAC into Europe, Middle East, Africa and India (EMEAI), and China & Southeast Asia (SEA).
- Navigate through the intricacies of Glaston Oyj Abp with our comprehensive balance sheet health report here.
- Gain insights into Glaston Oyj Abp's future direction by reviewing our growth report.
Lyckegård Group (OM:LYGRD)
Simply Wall St Financial Health Rating: ★★★★★☆
Overview: Lyckegård Group AB (publ) operates in Sweden, offering products and services for irrigation and outdoor environments, with a market cap of SEK198.74 million.
Operations: The company generates revenue of SEK218.04 million from its Farm Machinery & Equipment segment.
Market Cap: SEK198.74M
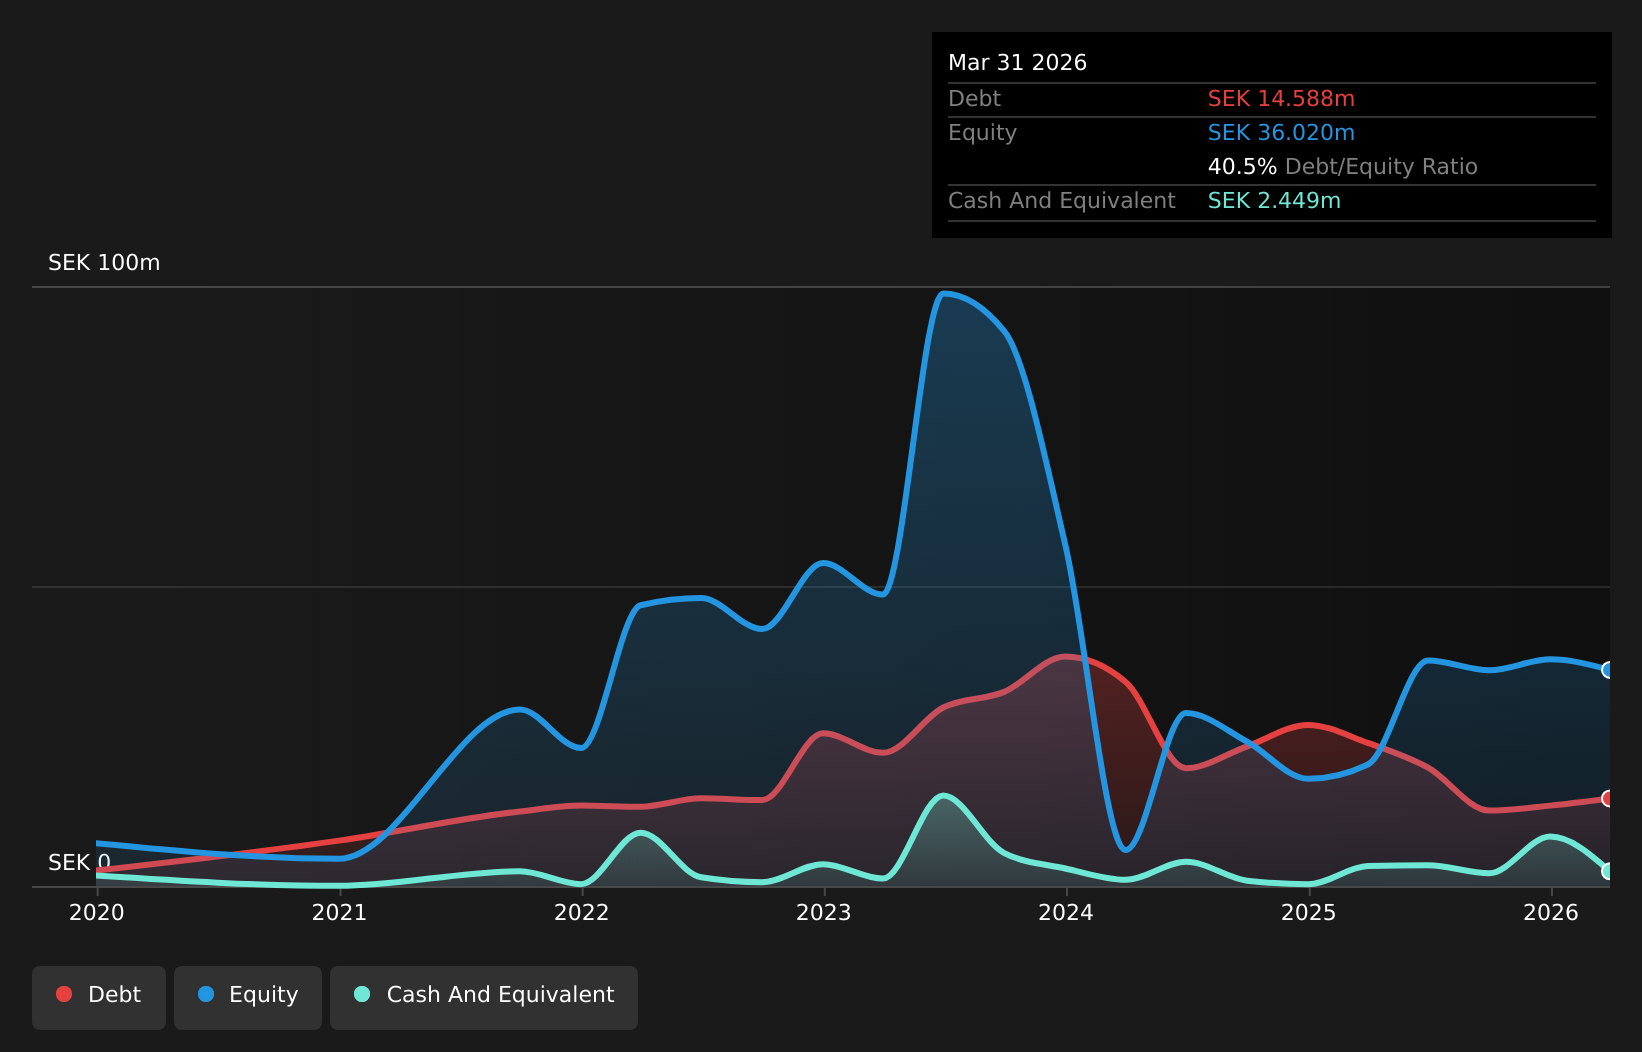
Lyckegård Group AB, with a market cap of SEK198.74 million, has recently become profitable, marking a significant shift in its financial trajectory. The company's revenue from its Farm Machinery & Equipment segment stands at SEK218.04 million. Its interest payments are well covered by EBIT (3.2x), and short-term assets exceed both short and long-term liabilities, indicating solid liquidity management. However, operating cash flow covers only 7.7% of debt, suggesting room for improvement in cash flow generation relative to debt levels. The board is experienced with an average tenure of 3.6 years, while Return on Equity remains low at 16.2%.
- Dive into the specifics of Lyckegård Group here with our thorough balance sheet health report.
- Gain insights into Lyckegård Group's past trends and performance with our report on the company's historical track record.
Turning Ideas Into Actions
- Click here to access our complete index of 303 European Penny Stocks.
- Searching for a Fresh Perspective? Trump's oil boom is here — pipelines are primed to profit. Discover the 23 US stocks riding the wave.
This article by Simply Wall St is general in nature. We provide commentary based on historical data and analyst forecasts only using an unbiased methodology and our articles are not intended to be financial advice. It does not constitute a recommendation to buy or sell any stock, and does not take account of your objectives, or your financial situation. We aim to bring you long-term focused analysis driven by fundamental data. Note that our analysis may not factor in the latest price-sensitive company announcements or qualitative material. Simply Wall St has no position in any stocks mentioned.
Have feedback on this article? Concerned about the content? Get in touch with us directly. Alternatively, email editorial-team@simplywallst.com