
Vinci (ENXTPA:DG) Stock Looks Reasonable As Its 65% Five Year Run Continues
Vinci stock has delivered a 65.0% total return over the past 5 years, and current checks suggest it now sits close to its intrinsic value on a Discounted Cash Flow (DCF) basis while still screening as undervalued on earnings-style multiples.
- The 65.0% return over 5 years signals that Vinci has already rewarded long-term holders, so fresh capital needs a clear view on what is priced in today.
- Recent strong performance in Energy Solutions and an active share buyback programme can support investor confidence, although ongoing geopolitical and macroeconomic pressures may still weigh on how much investors are willing to pay for the stock.
- Vinci scores 3 out of 6 on the broader valuation checks, which points to a mixed picture rather than a clear bargain or clear overvaluation.
The issue now is whether Vinci's current price around €124.50 still offers enough upside against its intrinsic value estimate to appeal to new investors after such a strong multi-year run.
Find out why Vinci's 3.6% return over the last year is lagging behind its peers.
Does Vinci Look Fairly Valued on Cash Flow?
The Discounted Cash Flow (DCF) model for Vinci starts from its recent cash generation and projects it forward based on cash flow projections. Vinci produced about €8.1b of free cash flow over the latest twelve months, and the model assumes broadly steady cash flows rather than sharp swings.
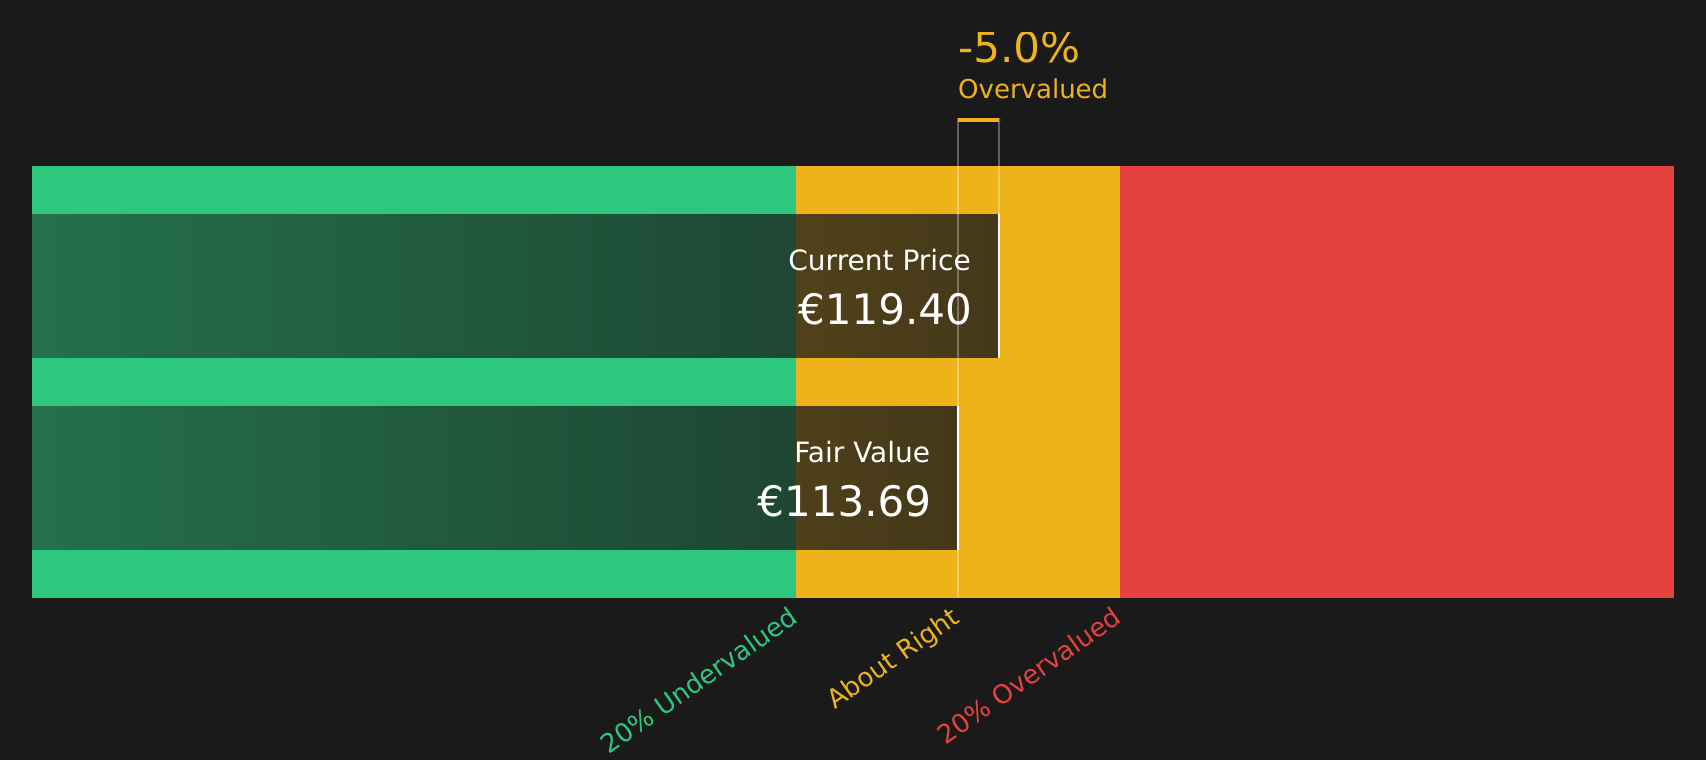
On these assumptions, the DCF model points to an intrinsic value of about €116 per share, compared with the current price around €124.50. That implies the stock screens around 7.6% overvalued on this cash flow view, so there is not much of a margin of safety for new buyers at today’s level. The strong H1 2026 update and confirmation of guidance help explain why Vinci trades above this intrinsic value estimate, as the market appears willing to pay up for the current momentum.
On balance, Vinci stock appears roughly fairly valued with a slight tilt to overvalued based on the current DCF estimate.
Vinci is fairly valued according to our Discounted Cash Flow (DCF), but this can change at a moment's notice. Track the value in your watchlist or portfolio and be alerted on when to act.
Is Vinci a Bargain on Earnings?
The P/E ratio is a useful metric for Vinci because earnings are a key anchor for investors in large, mature infrastructure and construction groups. On this measure, Vinci trades on a P/E of about 13.6x, which is slightly below the Construction industry average of roughly 14.2x and well under the peer average near 19.6x.
The fair P/E multiple implied by current models is about 23.7x, which is materially higher than where Vinci trades today. That gap suggests the market price does not fully reflect the earnings level implied by this framework, even after the strong H1 2026 update and ongoing share buyback programme.
Overall, Vinci stock appears undervalued on the P/E multiple compared with what the fair ratio implies.

See what the numbers say about this price — find out in our valuation breakdown.
The Vinci Narrative: What Would Justify Today's Price?
Simply Wall St Narratives for Vinci pick up where the valuation puzzle leaves off and spell out which assumptions on growth, margins and earnings would need to play out for the stock to be worth materially more or less than today’s price. Rather than relying on a single multiple or model, each narrative lays out the key drivers behind its fair value view so you can compare those assumptions with Vinci's actual results as they are reported. These Narratives sit on Simply Wall St's Community page, where you can explore different scenarios in more detail.
Vinci attracts two very different valuation stories from the community, and they sit a long way apart on what the stock is worth today.
Bull case: 13% undervalued
"Expansion in high-margin concessions, energy transition projects, and digitalization should enhance operating margins and diversify income streams..."
Read the full Bull Case to see why Vinci could be undervalued
Bear case: 23% overvalued
"Overall it seems Vinci is overvalued at the current prices or at least a little overvalued..."
Read the full Bear Case to see why Vinci could be overvalued
Do you think there's more to the story for Vinci? Head over to our Community to see what others are saying!
The Bottom Line
For Vinci, the Discounted Cash Flow (DCF) estimate points to only a small premium to intrinsic value, so the stock no longer looks obviously cheap on cash generation alone. The earnings multiple view still screens Vinci as undervalued relative to its implied fair P/E, which keeps the upside case alive but with a more mixed overall picture. The crux from here is whether Vinci can deliver the growth and margins that would justify a higher earnings multiple without stretching cash flows and funding needs too far.
This article by Simply Wall St is general in nature. We provide commentary based on historical data and analyst forecasts only using an unbiased methodology and our articles are not intended to be financial advice. It does not constitute a recommendation to buy or sell any stock, and does not take account of your objectives, or your financial situation. We aim to bring you long-term focused analysis driven by fundamental data. Note that our analysis may not factor in the latest price-sensitive company announcements or qualitative material. Simply Wall St has no position in any stocks mentioned.
Have feedback on this article? Concerned about the content? Get in touch with us directly. Alternatively, email editorial-team@simplywallst.com