
Skyworth Group (SEHK:751) Flags 170% Profit Growth, Is The Stock Too Expensive?
Why Skyworth Group’s latest guidance is drawing investor attention
Skyworth Group (SEHK:751) has issued earnings guidance for the six months to 30 June 2026, flagging an expected increase in unaudited consolidated net profit of at least 170% versus the same period in 2025.
The company links this jump mainly to significant gains on certain equity securities tied to semiconductor sector valuations, as well as higher sales, revenue and gross profit margin for smart devices in its smart systems technology business.
See our latest analysis for Skyworth Group.
Skyworth Group’s latest guidance lands after a mixed share price run, with the stock down 27.75% on a 90 day share price return and 12.55% on a year to date share price return, yet delivering a 40.68% total shareholder return over one year. This suggests recent news is reshaping how investors weigh its risks and potential.
If this earnings update has you thinking about where else growth or rerating potential might sit in hardware and connectivity, it could be a good moment to scan 37 robotics and automation stocks.
Skyworth Group now trades at a steep discount to analyst targets despite that sharp guidance driven jump in expected profit. Is the market rightly cautious about how much of this uplift is tied to volatile equity gains, or is it too pessimistic?
Price-to-earnings of 20.7x for Skyworth Group: Is it justified?
On the latest figures, Skyworth Group trades on a P/E of 20.7x, which sits above both its own estimated fair P/E of 15.1x and the Hong Kong Consumer Durables industry average of 8.4x. That points to a richer pricing of its earnings compared with both the broader peer group and the level suggested by the regression based fair ratio model.
The P/E ratio compares the current share price with earnings per share. For a company like Skyworth Group, which is active in consumer electronics, smart systems technology and new energy, this metric gives a quick read on how much investors are currently paying for each unit of profit. A higher P/E can reflect expectations for stronger earnings growth or a preference for the company’s specific mix of businesses, while a lower P/E can indicate more cautious expectations or a focus on near term profit pressure.
Analysts currently forecast Skyworth Group’s earnings to grow 40.5% per year over the next three years while revenue is expected to grow 1.9% per year, which is slower than the wider Hong Kong market. The combination of a relatively high P/E and stronger expected earnings growth than the market suggests investors are prepared to put a premium on its profit outlook even though revenue growth forecasts are more modest. The regression based fair P/E of 15.1x, which is below the current 20.7x, indicates a level that the market could move towards if sentiment around those earnings expectations cools or if delivery against forecasts becomes a bigger focus.
Compared with the Hong Kong Consumer Durables industry average P/E of 8.4x, Skyworth Group’s 20.7x multiple is more than double the sector level. That is a strong signal that the market is pricing in a different earnings profile to the typical stock in the group, whether because of its segment mix across smart household appliances, smart systems technology and new energy, or because of its recent share price performance and guidance linked to equity gains.
Explore the SWS fair ratio for Skyworth Group
Result: Price-to-earnings of 20.7x (OVERVALUED)
However, Skyworth Group’s reliance on equity securities gains and its higher P/E than sector peers could quickly be challenged if sentiment or earnings delivery wobbles.
Find out about the key risks to this Skyworth Group narrative.
Another view on Skyworth Group’s HK$4.53 share price
While the current 20.7x P/E suggests Skyworth Group looks expensive against its fair ratio of 15.1x, the SWS DCF model points in the same direction. At HK$4.53 the stock sits above an estimated future cash flow value of HK$3.63. That raises a simple question: how much optimism is already in the price?
Look into how the SWS DCF model arrives at its fair value.
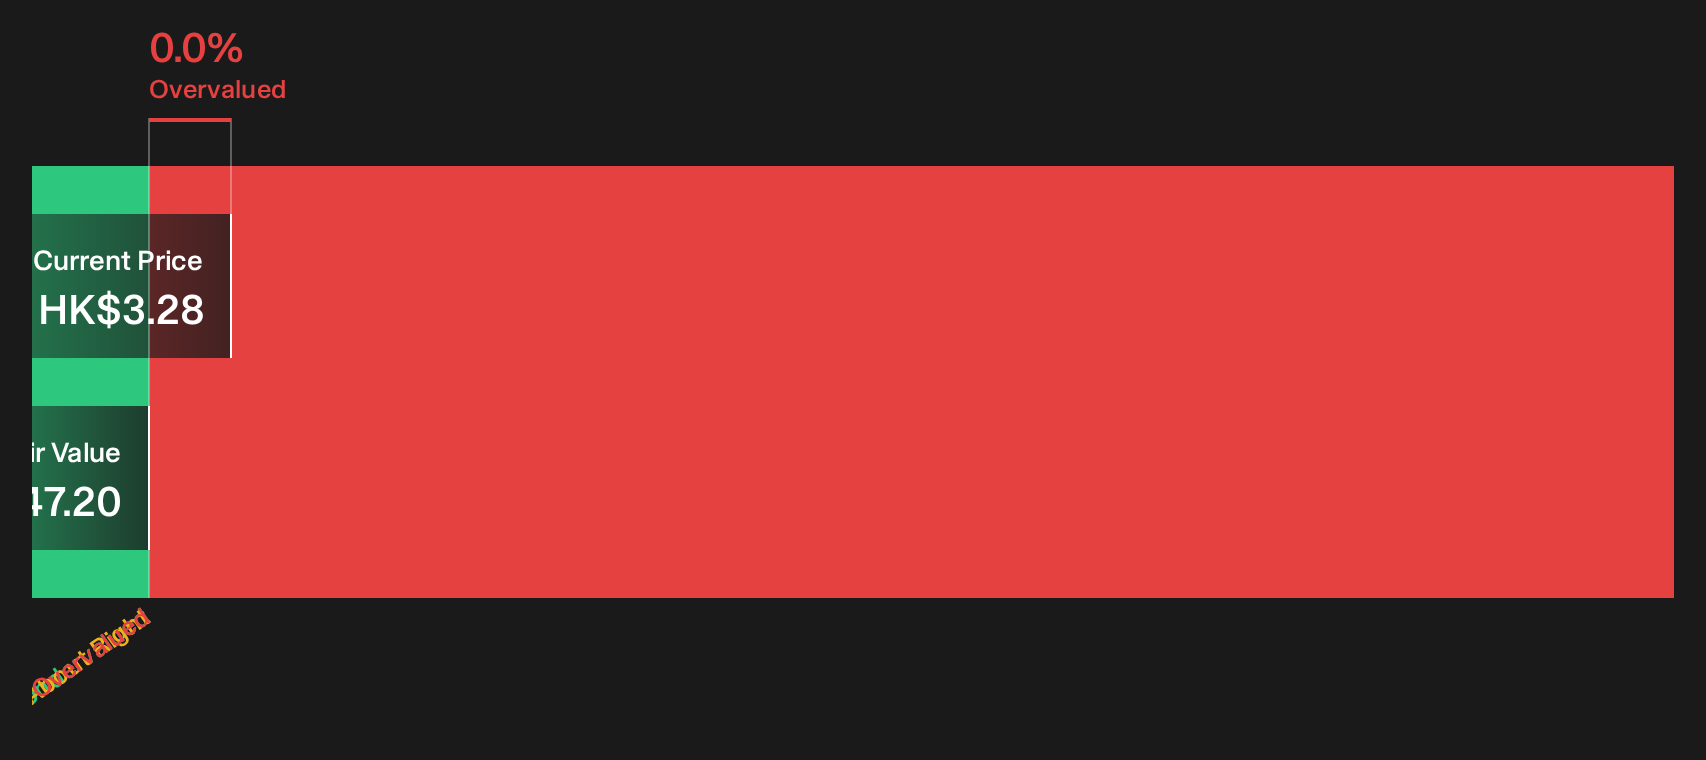
Simply Wall St performs a discounted cash flow (DCF) on every stock in the world every day (check out Skyworth Group for example). We show the entire calculation in full. You can track the result in your watchlist or portfolio and be alerted when this changes, or use our stock screener to discover 262 high quality undervalued stocks. If you save a screener we even alert you when new companies match - so you never miss a potential opportunity.
Next Steps
Given the mix of optimism and caution around Skyworth Group in this update, it makes sense to check the full picture yourself and move quickly if you want to. To weigh both sides of the story in one place, start with the 1 key reward and 1 important warning sign.
Looking for more Skyworth Group style investment ideas?
If Skyworth Group has sharpened your focus on pricing and quality, do not stop here. The next strong idea often comes from widening your search thoughtfully.
- Target potential value opportunities by scanning 262 high quality undervalued stocks that combine quality fundamentals with pricing that might not fully reflect their strengths.
- Focus on resilience first and filter for 297 resilient stocks with low risk scores so you can concentrate on companies where the risk profile is already screened for you.
- Get ahead of the crowd and review the screener containing 555 high quality undiscovered gems before they appear on everyone else's radar.
This article by Simply Wall St is general in nature. We provide commentary based on historical data and analyst forecasts only using an unbiased methodology and our articles are not intended to be financial advice. It does not constitute a recommendation to buy or sell any stock, and does not take account of your objectives, or your financial situation. We aim to bring you long-term focused analysis driven by fundamental data. Note that our analysis may not factor in the latest price-sensitive company announcements or qualitative material. Simply Wall St has no position in any stocks mentioned.
Have feedback on this article? Concerned about the content? Get in touch with us directly. Alternatively, email editorial-team@simplywallst.com