
European Dividend Stocks: Top 3 Picks
The European market has shown resilience, with the pan-European STOXX Europe 600 Index rising 1.70% recently, supported by a firmer risk appetite and solid earnings despite geopolitical uncertainties. In this environment, dividend stocks can offer investors a measure of stability and income potential, making them an attractive consideration for those navigating the current market landscape.
Top 10 Dividend Stocks In Europe
| Name | Dividend Yield | Dividend Rating |
| Telekom Austria (WBAG:TKA) | 4.14% | ★★★★★★ |
| Sulzer (SWX:SUN) | 3.15% | ★★★★★☆ |
| Rubis (ENXTPA:RUI) | 6.16% | ★★★★★★ |
| Revenio Group Oyj (HLSE:REG1V) | 3.25% | ★★★★★☆ |
| Naturgy Energy Group (BME:NTGY) | 6.12% | ★★★★★☆ |
| Hannover Rück (XTRA:HNR1) | 4.99% | ★★★★★★ |
| EFG International (SWX:EFGN) | 3.85% | ★★★★★☆ |
| Edel SE KGaA (XTRA:EDL) | 6.12% | ★★★★★★ |
| Cembra Money Bank (SWX:CMBN) | 5.34% | ★★★★★★ |
| Banque Cantonale Vaudoise (SWX:BCVN) | 3.59% | ★★★★★☆ |
Click here to see the full list of 188 stocks from our Top European Dividend Stocks screener.
Let's review some notable picks from our screened stocks.
Valsoia (BIT:VLS)
Simply Wall St Dividend Rating: ★★★★☆☆
Overview: Valsoia S.p.A. is an Italian company that offers plant-based and healthy food products both domestically and internationally, with a market capitalization of €112.33 million.
Operations: Valsoia S.p.A. generates its revenue primarily from its Healthy Food Products segment, which accounted for €117.85 million.
Dividend Yield: 3.7%
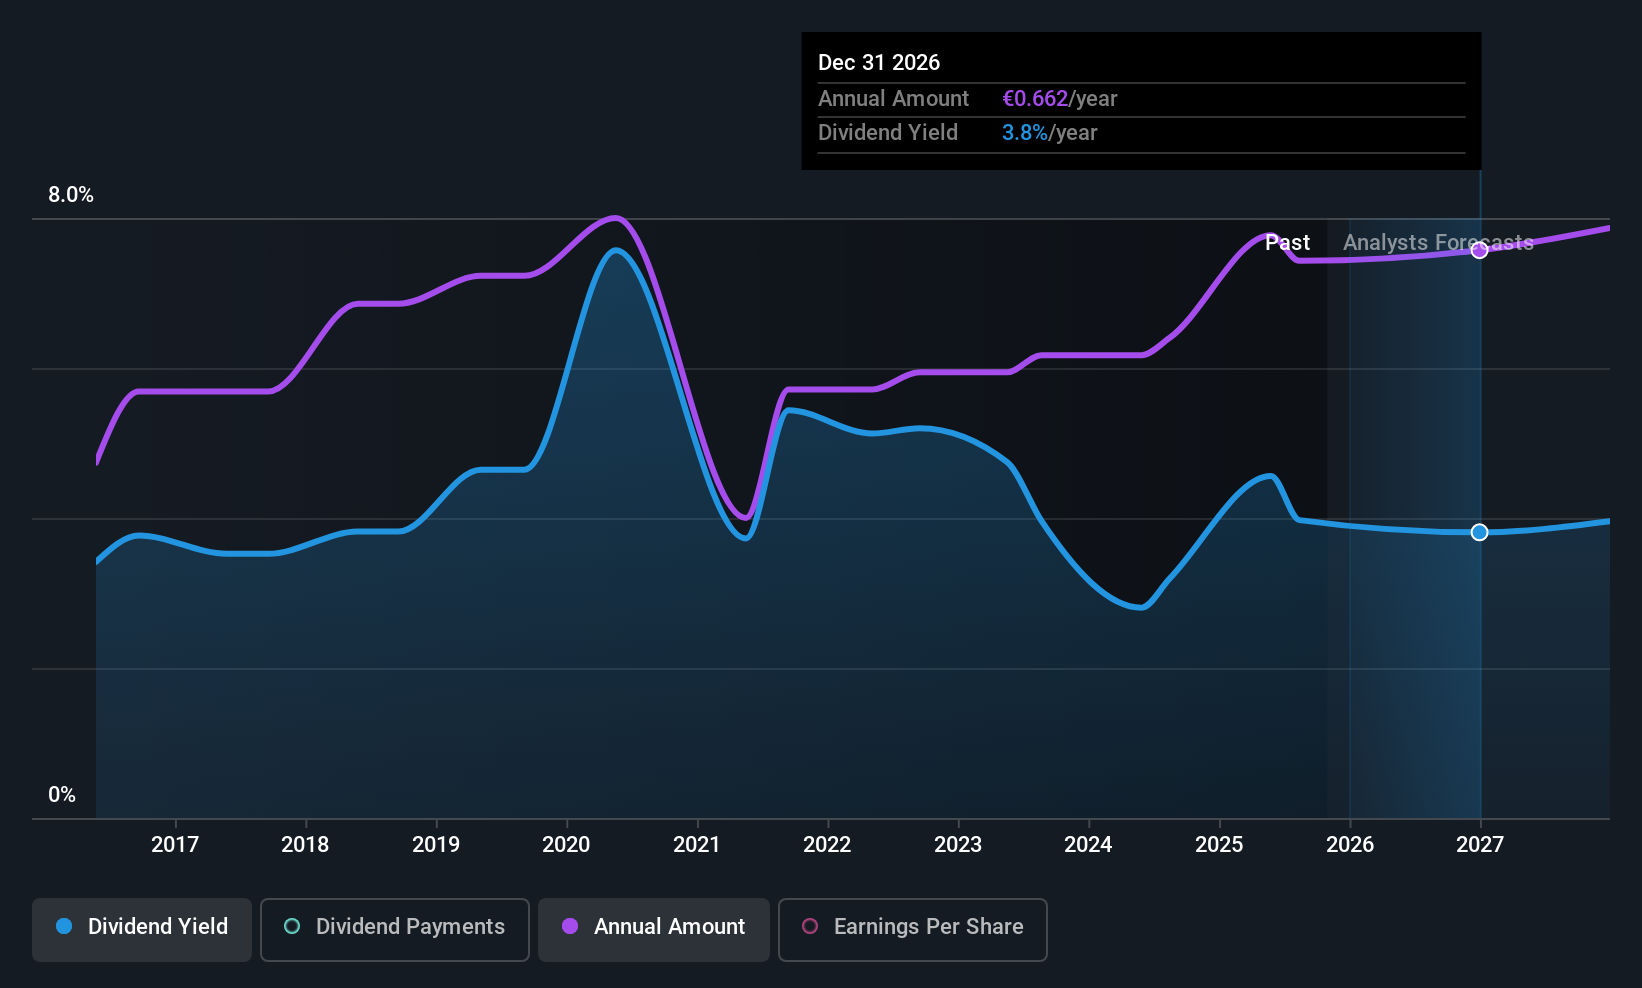
Valsoia's dividends have shown stability and growth over the past decade, with a payout ratio of 51.1% indicating coverage by earnings. However, the dividend yield of 3.65% is below Italy's top quartile at 4.68%, and payments are not supported by free cash flows or current earnings, raising sustainability concerns despite reliable historical payouts. The stock trades significantly below its estimated fair value, presenting potential valuation appeal amidst these dividend considerations.
- Click to explore a detailed breakdown of our findings in Valsoia's dividend report.
- Our expertly prepared valuation report Valsoia implies its share price may be lower than expected.

Galp Energia SGPS (ENXTLS:GALP)
Simply Wall St Dividend Rating: ★★★★☆☆
Overview: Galp Energia SGPS operates as an integrated energy company in Portugal and internationally, with a market cap of €15.48 billion.
Operations: Galp Energia SGPS generates revenue primarily from its Commercial segment (€10.94 billion), followed by Industrial & Midstream (€8.79 billion), Upstream (€3.58 billion), and Renewables and New Businesses (€78 million).
Dividend Yield: 3.4%
Galp Energia's dividends are well covered by earnings and cash flows, with payout ratios of 45.7% and 34.9%, respectively. Despite a decade of increasing payments, the dividend track record is volatile, reflecting instability in past distributions. The current yield of 3.41% falls short compared to top quartile payers in Portugal at 4.66%. Recent earnings show slight declines in net income despite increased revenue, potentially impacting future dividend reliability amidst valuation appeal below estimated fair value.
- Click here to discover the nuances of Galp Energia SGPS with our detailed analytical dividend report.
- Our expertly prepared valuation report Galp Energia SGPS implies its share price may be too high.
Wallenius Wilhelmsen (OB:WAWI)
Simply Wall St Dividend Rating: ★★★★☆☆
Overview: Wallenius Wilhelmsen ASA, along with its subsidiaries, operates in the global logistics and transportation sector, with a market capitalization of approximately NOK63.13 billion.
Operations: Wallenius Wilhelmsen ASA generates revenue through its Shipping Services segment at $3.96 billion, Logistics Services at $1.10 billion, and Government Services contributing $391 million.
Dividend Yield: 8.3%
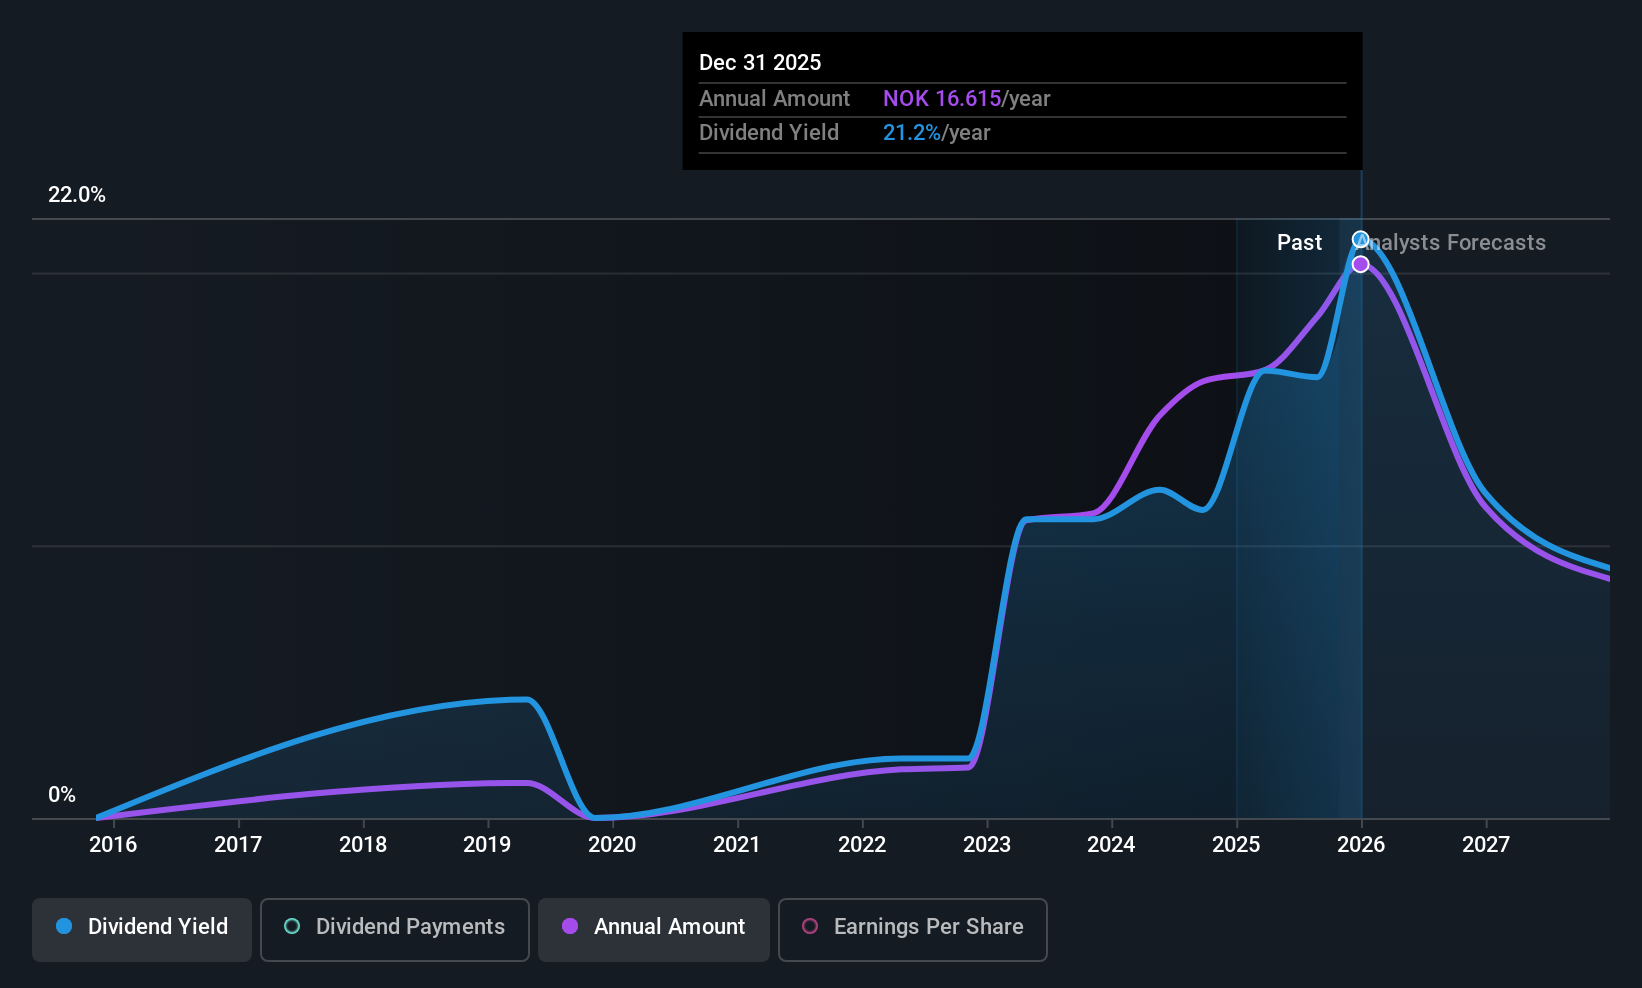
Wallenius Wilhelmsen's dividend yield of 8.33% places it among the top 25% in Norway, yet its track record is unstable with volatile payments over seven years. Despite this, dividends are covered by earnings and cash flows, with payout ratios at 58.2% and 41.8%, respectively. Trading at a significant discount to estimated fair value enhances its appeal, while a recent lucrative contract extension provides earnings visibility but may not stabilize future payouts amid forecasted earnings declines.
- Unlock comprehensive insights into our analysis of Wallenius Wilhelmsen stock in this dividend report.
- The valuation report we've compiled suggests that Wallenius Wilhelmsen's current price could be quite moderate.
Summing It All Up
- Get an in-depth perspective on all 188 Top European Dividend Stocks by using our screener here.
- Have a stake in these businesses? Integrate your holdings into Simply Wall St's portfolio for notifications and detailed stock reports.
- Simply Wall St is a revolutionary app designed for long-term stock investors, it's free and covers every market in the world.
Ready For A Different Approach?
- Explore high-performing small cap companies that haven't yet garnered significant analyst attention.
- Fuel your portfolio with companies showing strong growth potential, backed by optimistic outlooks both from analysts and management.
- Find companies with promising cash flow potential yet trading below their fair value.
This article by Simply Wall St is general in nature. We provide commentary based on historical data and analyst forecasts only using an unbiased methodology and our articles are not intended to be financial advice. It does not constitute a recommendation to buy or sell any stock, and does not take account of your objectives, or your financial situation. We aim to bring you long-term focused analysis driven by fundamental data. Note that our analysis may not factor in the latest price-sensitive company announcements or qualitative material. Simply Wall St has no position in any stocks mentioned.
Have feedback on this article? Concerned about the content? Get in touch with us directly. Alternatively, email editorial-team@simplywallst.com