
Terreno Realty (TRNO) Added A Torrance Property, Is The Stock Fairly Valued?
Terreno Realty (TRNO) shares are in focus after the company acquired a fully leased industrial property in Torrance, California, for about $14.7 million, adding a 36,000 square foot distribution building to its coastal portfolio.
See our latest analysis for Terreno Realty.
Terreno Realty's latest Torrance acquisition and recent lease expansions come after a period where momentum has cooled slightly in the very short term, with the 7 day share price return down 2.98%. However, the year to date share price return of 15.66% and 1 year total shareholder return of 30.80% still point to stronger performance over a longer horizon.
If this kind of real assets story interests you, it can be useful to see what else is moving in related areas, including companies supporting the power needs of warehouses and data centers through the 36 power grid technology and infrastructure stocks
Terreno Realty has just added fresh assets and lifted its dividend, yet the share price sits below the average analyst target and slightly above one intrinsic estimate. Where does fair value really land in that spread?
Price-to-Earnings of 19.2x: Is it justified?
On Simply Wall St's numbers, Terreno Realty trades on a P/E of 19.2x, which sits between its own fair P/E estimate and different industry reference points.
The P/E ratio compares the company’s share price to its earnings per share. For an industrial REIT like Terreno Realty, it gives a quick read on how much investors are paying for each dollar of recent earnings.
TRNO is described as good value versus an estimated fair P/E of 25.2x and a peer average of 37.2x. Against those yardsticks, the current 19.2x suggests the market price is lower than levels that could be supported if those comparative multiples held. However, compared with the broader Global Industrial REITs P/E of 15.5x, Terreno Realty screens as more expensive, which points to a premium versus that wider group.
This combination of lower levels versus some peers and the fair P/E, yet a premium to the global industry, gives investors a clear benchmark if the market were to move closer to the estimated fair ratio.
Explore the SWS fair ratio for Terreno Realty
Result: Price-to-Earnings of 19.2x (ABOUT RIGHT)
However, Terreno Realty still faces risks if leasing momentum slows or if the current P/E premium to the broader industrial REIT group contracts further.
Find out about the key risks to this Terreno Realty narrative.
Another View on Terreno Realty's Value
The P/E checks suggest Terreno Realty looks reasonable, yet the SWS DCF model points a little differently. On those cash flow assumptions, the stock at $68.26 sits modestly above an estimated value of $66.50, which reads as slightly overvalued rather than cheap. Which lens do you trust more?
For a closer look at how those cash flows are modeled and where the gaps might sit, Look into how the SWS DCF model arrives at its fair value.
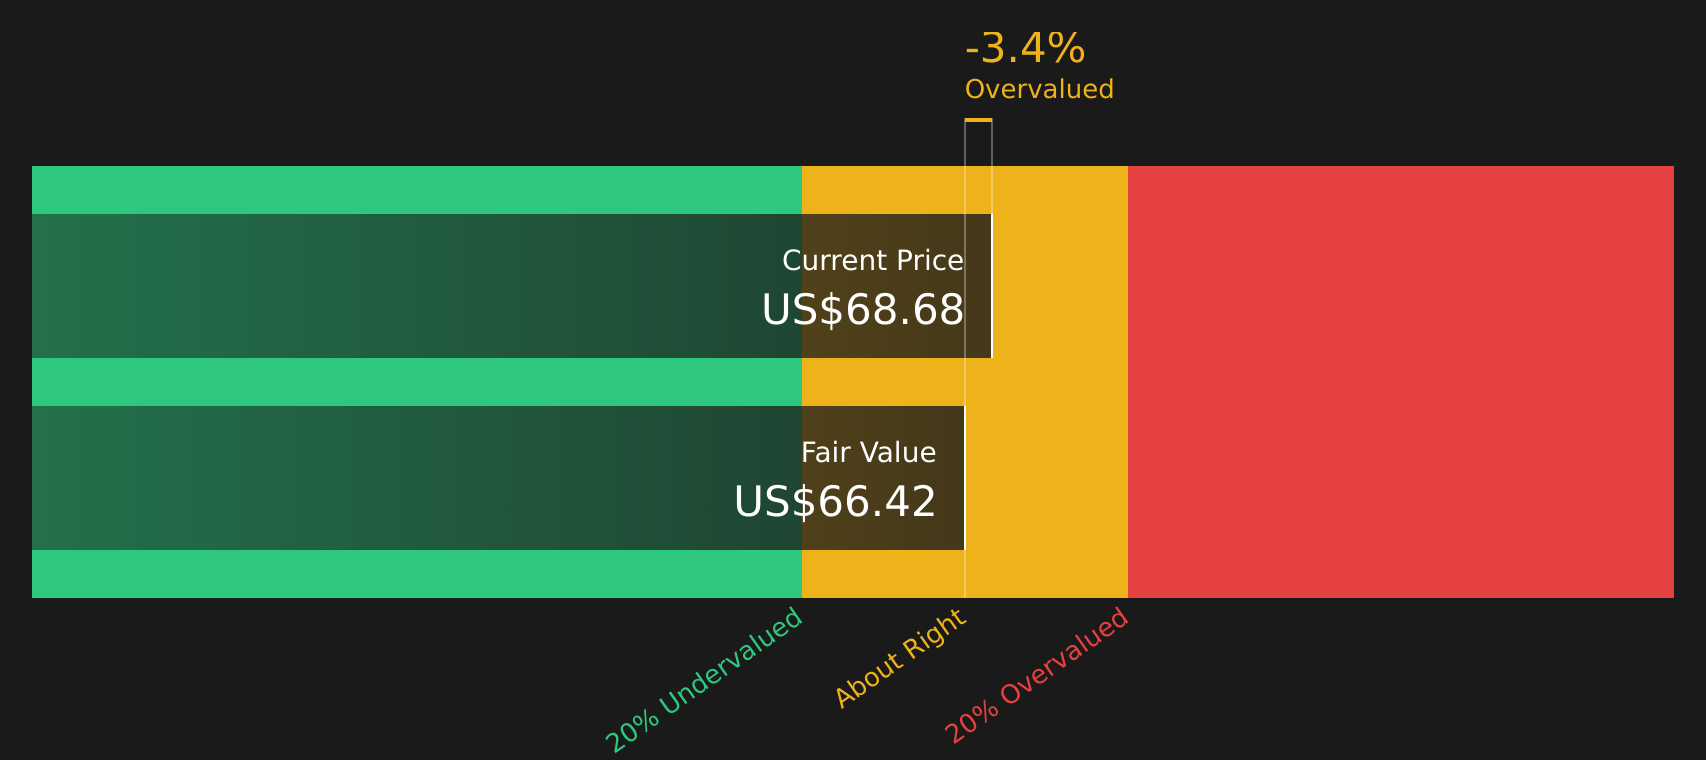
Simply Wall St performs a discounted cash flow (DCF) on every stock in the world every day (check out Terreno Realty for example). We show the entire calculation in full. You can track the result in your watchlist or portfolio and be alerted when this changes, or use our stock screener to discover 49 high quality undervalued stocks. If you save a screener we even alert you when new companies match - so you never miss a potential opportunity.
Next Steps
If the mixed signals around Terreno Realty leave you unsure, now is a good time to look under the hood yourself and weigh both sides of the story. To see the balance of concerns and positives already flagged by the data, take a closer look at the 3 key rewards and 3 important warning signs.
Looking for more ideas beyond Terreno Realty?
If you are serious about building a stronger portfolio, do not stop with Terreno Realty. Use the Simply Wall St screener to uncover more focused ideas right now.
- Target stability and income by reviewing companies tagged as 8 dividend fortresses that may offer meaningful yields with more resilient cash flows.
- Hunt for potential bargains by scanning the 49 high quality undervalued stocks that match your preferred mix of quality and valuation.
- Get ahead of the crowd by checking the screener containing 20 high quality undiscovered gems before other investors start paying closer attention.
This article by Simply Wall St is general in nature. We provide commentary based on historical data and analyst forecasts only using an unbiased methodology and our articles are not intended to be financial advice. It does not constitute a recommendation to buy or sell any stock, and does not take account of your objectives, or your financial situation. We aim to bring you long-term focused analysis driven by fundamental data. Note that our analysis may not factor in the latest price-sensitive company announcements or qualitative material. Simply Wall St has no position in any stocks mentioned.
Have feedback on this article? Concerned about the content? Get in touch with us directly. Alternatively, email editorial-team@simplywallst.com