
ams-OSRAM (SWX:AMS) Shares Jumped, What Is Behind The Move?
ams-OSRAM (SWX:AMS) shares are in focus after the company reported Q2 2026 results showing higher sales but a larger net loss, alongside fresh Q3 guidance and a softer full year revenue outlook.
See our latest analysis for ams-OSRAM.
The Q2 update and new Q3 guidance follow a strong rebound in ams-OSRAM's share price, with a year-to-date share price return of 122.75% and a 1-year total shareholder return of 81.21%, although the 5-year total shareholder return is down 79.53%.
If this earnings move has you looking beyond ams-OSRAM, it could be a moment to scan for other chip and sensor suppliers positioned for structural demand with our 57 AI infrastructure stocks
After a sharp rebound in ams-OSRAM shares despite ongoing losses and softer revenue guidance, the key issue now is whether this move reflects a genuine reset in how the business is valued or just a sentiment swing that went too far.
Preferred Price-to-Sales of 0.6x: Is It Justified?
At the last close of CHF19.19, ams-OSRAM is described as trading at good value compared to peers, with a Price-to-Sales ratio of 0.6x and a discount of 66.7% to one DCF based fair value estimate of CHF57.71 per share.
The P/S multiple compares the company’s market value to its annual revenue and is often used when earnings are negative, as is the case with ams-OSRAM. For a business that remains unprofitable and is forecast to stay that way over the next 3 years, investors often lean on revenue based measures when judging whether current pricing already reflects that lack of profitability.
What stands out is how low this 0.6x P/S ratio is relative to both peers and the broader European Semiconductor industry. Statements indicate ams-OSRAM trades at good value versus a peer average P/S of 15.8x and an industry average of 4.5x, and also sits below an estimated fair P/S ratio of 1.2x that the market could potentially move toward if sentiment and expectations align with those fair value assumptions.
Explore the SWS fair ratio for ams-OSRAM
Result: Price-to-Sales of 0.6x (UNDERVALUED)
However, ams-OSRAM still reports a net loss of €324 million and remains below analyst price targets. Any setback on profitability or guidance could quickly challenge this reset.
Find out about the key risks to this ams-OSRAM narrative.
Another View on ams-OSRAM’s Valuation
The earlier focus was on ams-OSRAM’s low 0.6x P/S ratio. Our DCF model points in the same direction and indicates a fair value of CHF57.71 per share, which is well above the current CHF19.19 price. That still leaves a question: How comfortable are you relying on cash flow forecasts when profits are not yet in sight?
Look into how the SWS DCF model arrives at its fair value.
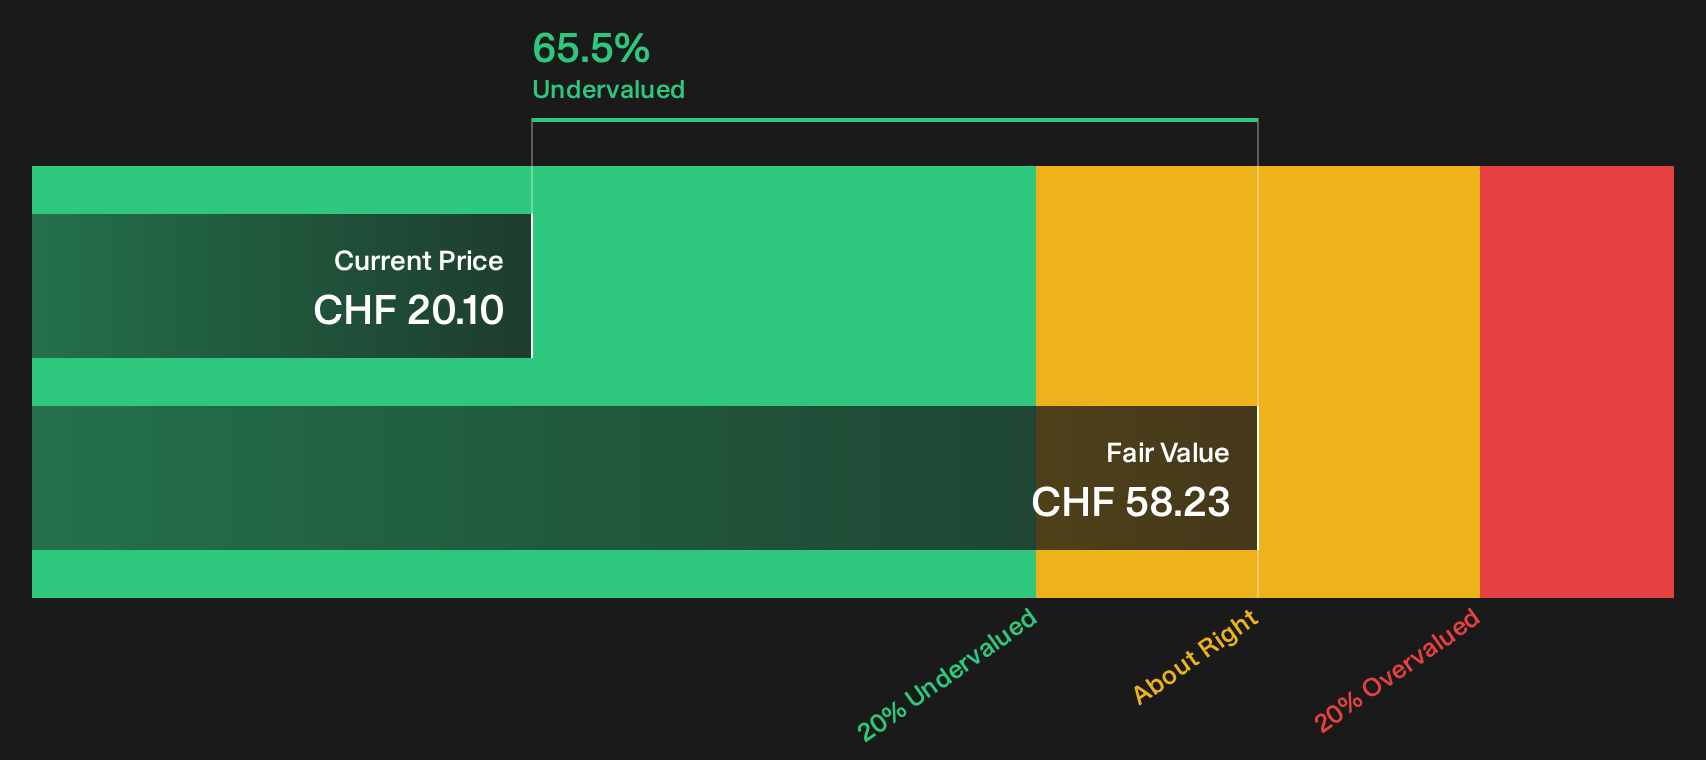
Simply Wall St performs a discounted cash flow (DCF) on every stock in the world every day (check out ams-OSRAM for example). We show the entire calculation in full. You can track the result in your watchlist or portfolio and be alerted when this changes, or use our stock screener to discover 259 high quality undervalued stocks. If you save a screener we even alert you when new companies match - so you never miss a potential opportunity.
Next Steps
With sentiment on ams-OSRAM split between concern over risks and optimism about potential rewards, act quickly and review the numbers yourself so you can decide where you stand. To frame that view with a balanced checklist of potential upsides and downside flags, start with these 3 key rewards and 2 important warning signs.
Looking for more investment ideas beyond ams-OSRAM?
Do not stop your research with ams-OSRAM. Use the Simply Wall St Screener to compare other opportunities and pressure test your conviction across different types of stocks.
- Target resilient income by reviewing companies screened as potential 440 dividend fortresses that may suit investors who prioritise regular payouts.
- Hunt for mispriced opportunities by scanning the 259 high quality undervalued stocks that combine quality fundamentals with attractive pricing.
- Focus on financial strength by concentrating on businesses in the solid balance sheet and fundamentals stocks screener (423 results) that may offer more robust balance sheets.
This article by Simply Wall St is general in nature. We provide commentary based on historical data and analyst forecasts only using an unbiased methodology and our articles are not intended to be financial advice. It does not constitute a recommendation to buy or sell any stock, and does not take account of your objectives, or your financial situation. We aim to bring you long-term focused analysis driven by fundamental data. Note that our analysis may not factor in the latest price-sensitive company announcements or qualitative material. Simply Wall St has no position in any stocks mentioned.
Have feedback on this article? Concerned about the content? Get in touch with us directly. Alternatively, email editorial-team@simplywallst.com