
Why Shimadzu (TSE:7701) Shares Climbed After Its Latest Update
Shimadzu (TSE:7701) drew investor attention on 6 August 2026 after reporting first quarter sales of ¥130,596 million and net income of ¥13,333 million, alongside an updated full year earnings forecast.
See our latest analysis for Shimadzu.
Shimadzu’s share price closed at ¥4,214 on 11 August 2026, with a 90 day share price return of 20.75% and a 1 year total shareholder return of 19.71%. This points to improving momentum compared with its more muted 3 and 5 year total returns.
After a strong earnings update like this, many investors also look for other potential ideas in related areas, including companies exposed to robotics and automation. You can use the Simply Wall St screener to check out 39 robotics and automation stocks
Shimadzu now trades below the average analyst price target, yet its own model based fair value sits above the current share price. Is the recent rally still pricing in too much caution, or not enough?
Price-to-Earnings of 18.5x for Shimadzu: Is it justified?
On the latest figures, Shimadzu trades on a P/E of 18.5x, which suggests the current ¥4,214 share price builds in a moderate earnings premium compared with some peers and the stock still sits slightly above certain fair value estimates.
The P/E multiple compares what investors pay per share to the earnings generated per share. For a business like Shimadzu, with exposure to analytical instruments, medical systems and industrial equipment, this is a commonly watched yardstick because earnings quality and consistency are central to how investors frame the story.
There are a few moving parts here. Shimadzu is described as good value relative to its peer average P/E of 22.3x. However, it screens as expensive versus both the broader JP Electronic industry average of 16x and an estimated fair P/E of 17.4x. That suggests the current multiple sits between two reference points. It is lower than what similar companies are trading at on average, but higher than what the SWS fair ratio model implies could be a more balanced level over time.
Compared with the JP Electronic industry, Shimadzu’s 18.5x P/E stands at a premium to the 16x average, even though its 1 year total shareholder return of 19.71% has lagged the sector’s 82.5% result. The fair P/E estimate of 17.4x also comes in below the current multiple, which reinforces the idea that the market is paying up somewhat for its earnings profile relative to what the regression based fair ratio would indicate.
Explore the SWS fair ratio for Shimadzu
Result: Price-to-Earnings of 18.5x (OVERVALUED)
However, investors still face risks if demand for Shimadzu’s analytical and medical equipment slows, or if the JP Electronic sector’s strong recent 82.5% return reverses.
Find out about the key risks to this Shimadzu narrative.
Another view on Shimadzu’s valuation
The SWS DCF model points in the opposite direction to the P/E story for Shimadzu. On this view, the estimated value of future cash flows is ¥3,697 per share, which sits below the current ¥4,214 price. That implies the stock screens as overvalued on a cash flow basis. Which lens do you trust more for your own process?
For readers who want to see how this cash flow based view is built line by line, it is worth reviewing the full SWS DCF model output: Look into how the SWS DCF model arrives at its fair value.
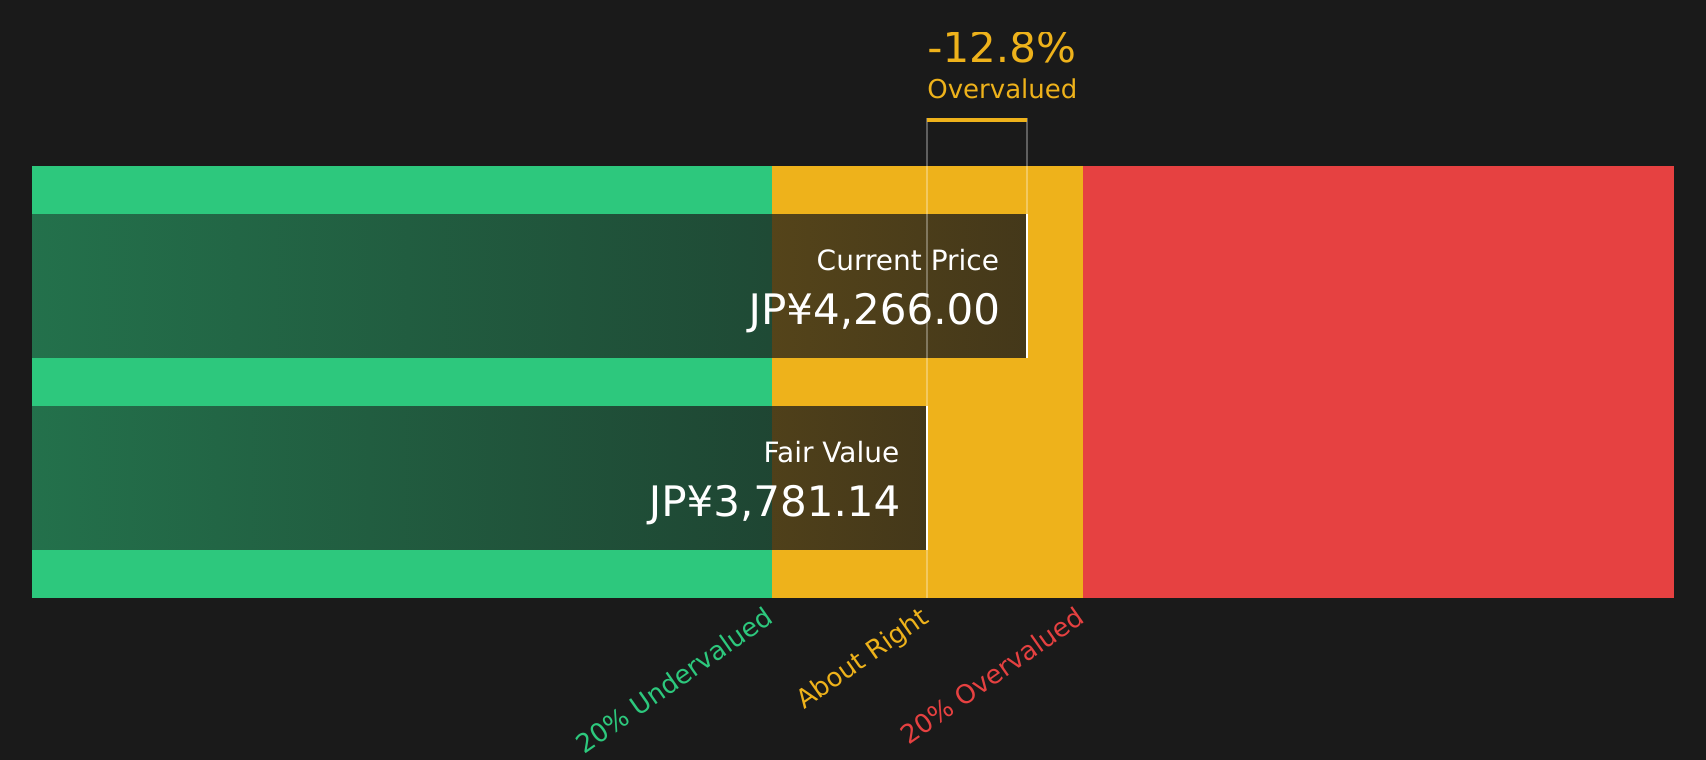
Simply Wall St performs a discounted cash flow (DCF) on every stock in the world every day (check out Shimadzu for example). We show the entire calculation in full. You can track the result in your watchlist or portfolio and be alerted when this changes, or use our stock screener to discover 22 high quality undervalued stocks. If you save a screener we even alert you when new companies match - so you never miss a potential opportunity.
Next Steps
Wondering how this mixed valuation picture for Shimadzu lines up with broader investor optimism? Take a closer look at the details and pressure test the positives that others are focused on by reviewing the 2 key rewards.
Looking for more Shimadzu sized investment ideas?
If Shimadzu has sharpened your interest, do not stop here. The next promising opportunity could already be on your radar if you use the right tools.
- Target resilient income potential by checking out companies in the 37 dividend fortresses that could support more consistent payout profiles.
- Hunt for mispriced quality by scanning the 22 high quality undervalued stocks that combine stronger fundamentals with more modest expectations.
- Prioritise capital preservation by reviewing the 54 resilient stocks with low risk scores that score well on balance sheet strength and risk filters.
This article by Simply Wall St is general in nature. We provide commentary based on historical data and analyst forecasts only using an unbiased methodology and our articles are not intended to be financial advice. It does not constitute a recommendation to buy or sell any stock, and does not take account of your objectives, or your financial situation. We aim to bring you long-term focused analysis driven by fundamental data. Note that our analysis may not factor in the latest price-sensitive company announcements or qualitative material. Simply Wall St has no position in any stocks mentioned.
Have feedback on this article? Concerned about the content? Get in touch with us directly. Alternatively, email editorial-team@simplywallst.com