
Is General American Investors Company (GAM) A Bargain After Its Half Year Earnings?
What General American Investors Company’s Latest Earnings Tell You
General American Investors Company (GAM) released half year earnings for the period to June 30, 2026, reporting revenue of US$12.67 million and net income of US$187.19 million, giving investors fresh insight into portfolio results.
See our latest analysis for General American Investors Company.
Against this latest earnings release, General American Investors Company’s share price has continued to trend higher, with a 30 day share price return of 4.37% and a year to date share price return of 14.50%. Over a longer horizon, the stock’s 1 year total shareholder return of 27.59% and 5 year total shareholder return of 121.92% point to sustained compounding, suggesting recent price moves are being viewed through a longer term performance lens.
If this kind of steady compounding appeals to you, it can help to broaden your search and see what else is working. Take a look at the 18 top founder-led companies
After that strong run and a sizable estimated discount to intrinsic value, the real test for General American Investors Company is whether the current price still offers an attractive balance between upside and downside risk.
Price-to-Earnings of 4.4x: Is it justified?
On the latest figures, General American Investors Company trades on a P/E of 4.4x, which is paired with a last close of $67.35 and a large estimated discount to intrinsic value.
The P/E ratio compares the current share price with the company’s earnings per share. For an investment manager like General American Investors Company, it gives you a quick read on how much investors are paying for current earnings from its portfolio and fee streams. A low P/E can sometimes indicate the market is cautious about the quality or durability of those earnings, or it can suggest investors are not assigning a high value to recent profit growth.
Here, the current 4.4x P/E is well below both the US Capital Markets industry average of 37.9x and the peer average of 15.5x. That is a steep gap, and it means the stock is priced at a fraction of what investors are paying for similar companies, even after factoring in the strong recent earnings growth and the influence of one off gains on reported profit.
See what the numbers say about this price — find out in our valuation breakdown.
Result: Price-to-Earnings of 4.4x (UNDERVALUED)
However, you should still watch for portfolio concentration in US growth stocks and any shift in the estimated discount to intrinsic value that weakens the value case.
Find out about the key risks to this General American Investors Company narrative.
Another View on General American Investors Company’s Value
The earlier P/E discussion presents General American Investors Company as inexpensive. Our DCF model points in the same direction. At a share price of $67.35, General American Investors Company trades below an estimated future cash flow value of $146.64, which suggests the stock is undervalued according to this model.
That is a significant gap for any investor to weigh carefully. Look into how the SWS DCF model arrives at its fair value.
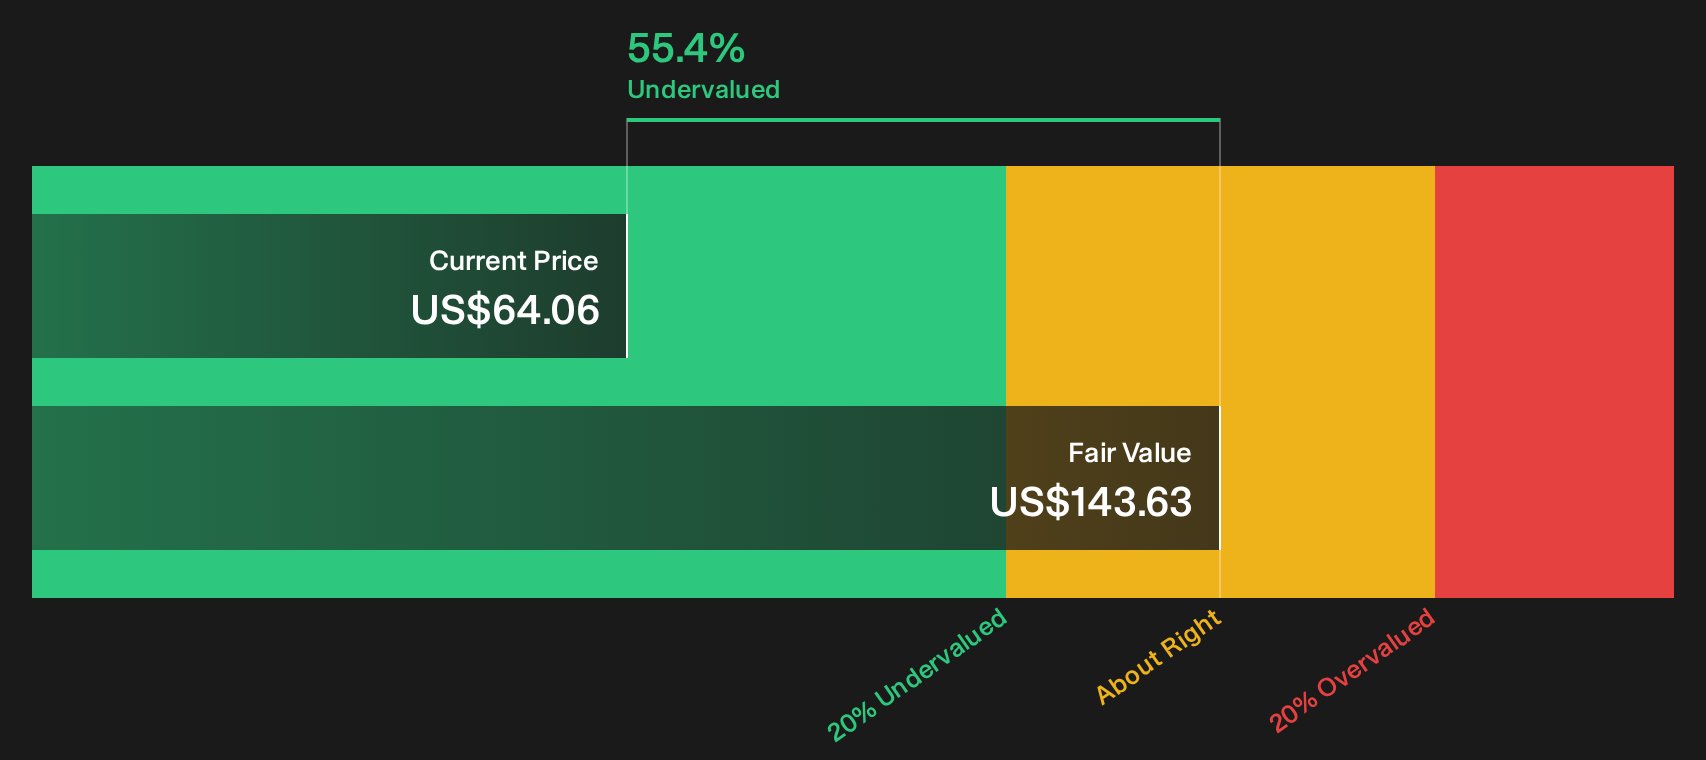
Simply Wall St performs a discounted cash flow (DCF) on every stock in the world every day (check out General American Investors Company for example). We show the entire calculation in full. You can track the result in your watchlist or portfolio and be alerted when this changes, or use our stock screener to discover 49 high quality undervalued stocks. If you save a screener we even alert you when new companies match - so you never miss a potential opportunity.
Next Steps
Does this mix of valuation signals from General American Investors Company leave you excited or cautious? Act while the data is front of mind and review both sides of the story with the 2 key rewards and 2 important warning signs
Looking for more investment ideas beyond General American Investors Company?
If General American Investors Company has sharpened your focus, do not stop here. Use the Simply Wall St screener to quickly surface fresh opportunities that fit your style.
- Target steady cash generators by checking companies with resilient payouts in the 8 dividend fortresses
- Spot potential value opportunities early and see which stocks still trade below their fundamentals through the 49 high quality undervalued stocks
- Hunt for future standouts before the crowd pays attention by scanning the screener containing 20 high quality undiscovered gems
This article by Simply Wall St is general in nature. We provide commentary based on historical data and analyst forecasts only using an unbiased methodology and our articles are not intended to be financial advice. It does not constitute a recommendation to buy or sell any stock, and does not take account of your objectives, or your financial situation. We aim to bring you long-term focused analysis driven by fundamental data. Note that our analysis may not factor in the latest price-sensitive company announcements or qualitative material. Simply Wall St has no position in any stocks mentioned.
Have feedback on this article? Concerned about the content? Get in touch with us directly. Alternatively, email editorial-team@simplywallst.com