
Arbor Realty Trust (ABR) Stock May Be Undervalued As Shares Fell 52%
Arbor Realty Trust stock is caught between a weak share price record and a split valuation picture, with the intrinsic value estimate from the Excess Returns model pointing to meaningful upside while market multiples suggest the shares are not cheap on more conventional metrics.
- Over the past 3 years, Arbor Realty Trust shares have declined 52.5%, which means anyone buying over that period has faced a materially negative total return.
- The recent securitization and additional liquidity can support ongoing lending activity, while the recent net loss and continued need to manage funding costs remain a key risk for how investors price the stock.
- On Simply Wall St's broader checks, Arbor Realty Trust screens as undervalued on only 2 of 6 measures, which leans more toward the stock not being a clear bargain overall.
For investors, the debate is whether the current US$5.22 share price already reflects these mixed signals or if the Excess Returns estimate of undervaluation still leaves room for upside.
Find out why Arbor Realty Trust's -51.0% return over the last year is lagging behind its peers.
Is Arbor Realty Trust Still Cheap on Excess Returns?
The Excess Returns model evaluates how efficiently Arbor Realty Trust converts its equity base into earnings after covering the cost of that equity. For Arbor, the inputs indicate a company generating a moderate return on its book value, but with a cost of equity that exceeds the level supported by those earnings.
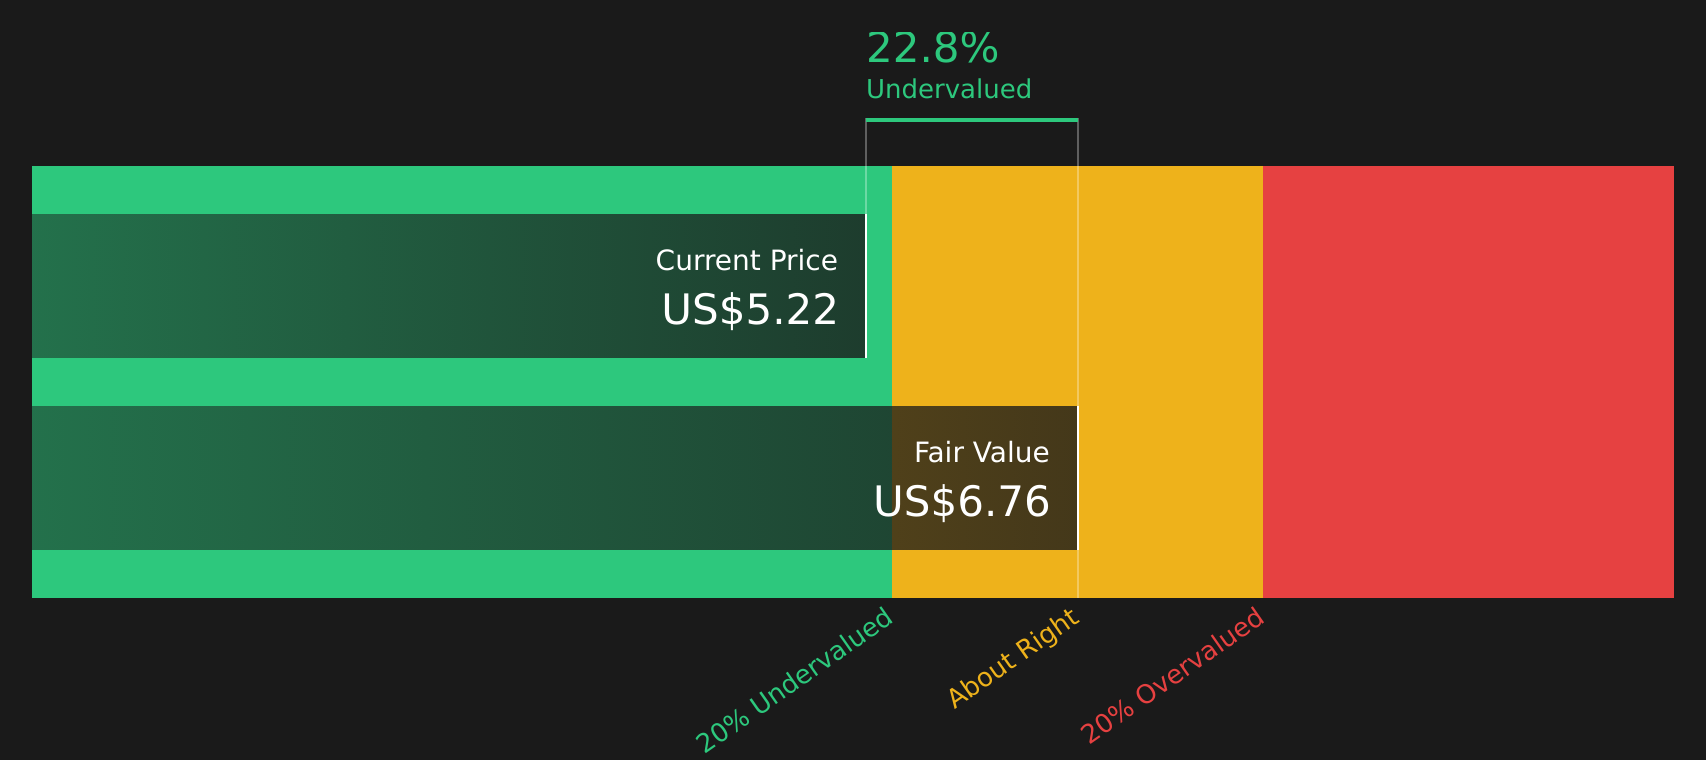
Book Value is $11.35 per share and Stable EPS is $0.95 per share, based on the median return on equity from the past 5 years, compared with a Cost of Equity of $1.27 per share. That results in an Excess Return of $0.32 per share in the negative direction, with an Average Return on Equity of 9.01% and a Stable Book Value of $10.60 per share using analyst estimates. Even so, the Excess Returns framework still arrives at an intrinsic value of about $6.76 per share versus the current $5.22 share price, which suggests Arbor Realty Trust screens as 22.8% undervalued.
Because the recent net loss in the second quarter of 2026 is fresh in investors’ minds, the gap between the model value and the share price likely reflects caution regarding the consistency of future returns.
On this Excess Returns view, Arbor Realty Trust stock currently appears undervalued relative to its estimated intrinsic value.
Our Excess Returns analysis suggests Arbor Realty Trust is undervalued by 22.8%. Track this in your watchlist or portfolio, or discover 49 more high quality undervalued stocks.
Is Arbor Realty Trust Getting Expensive on Earnings?
P/E is often the cleanest way to compare a company like Arbor Realty Trust with other mortgage REITs that also focus on earnings from lending and servicing activity.
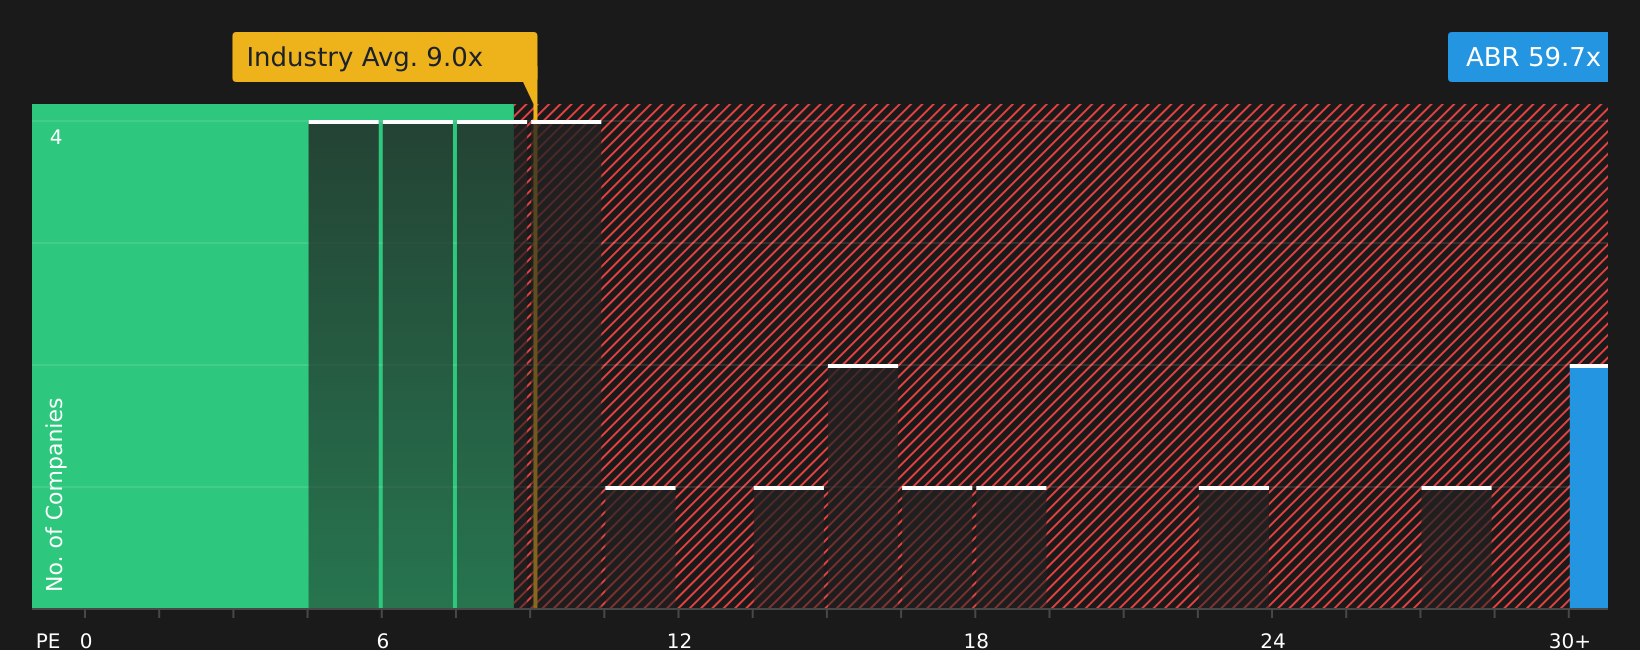
Arbor Realty Trust is currently trading on a P/E of about 59.7x, which is high against the Mortgage REITs industry average of 8.9x and a peer average of 11.8x. The Fair Ratio from Simply Wall St's model is 25.1x, which is the multiple that might fit Arbor given its size, profitability profile and risk factors. The gap between the current P/E and this Fair Ratio indicates investors are paying a significant premium for each dollar of reported earnings at the recent US$5.22 share price.
Even with the stock down heavily over the past three years, the current P/E still points to Arbor Realty Trust screening as expensive relative to both sector benchmarks and the tailored Fair Ratio.
On the P/E multiple, Arbor Realty Trust stock appears overvalued compared with both its industry and the modelled Fair Ratio.
See what the numbers say about this price — find out in our valuation breakdown.
The Arbor Realty Trust Narrative: What Would Justify Today's Price?
Simply Wall St Narratives for Arbor Realty Trust pick up where this valuation puzzle leaves off by spelling out the specific paths for revenue, margins and earnings that would need to hold for the stock to be worth meaningfully more or less than today’s price on the Community page. Rather than providing a single output from a P/E or Excess Returns model, these scenarios describe the future those numbers rely on so you can watch how Arbor Realty Trust's actual performance lines up over time.
Use this moment to add your own narrative on Arbor Realty Trust's stock and lay out a clear, number-driven view on whether its recent securitization and liquidity moves can support the current valuation. Share your thesis now so you can track how it holds up as Arbor Realty Trust's results and capital markets activity evolve.
Do you think there's more to the story for Arbor Realty Trust? Head over to our Community to see what others are saying!
The Bottom Line
Arbor Realty Trust sits between an intrinsic value estimate that screens the stock as undervalued and a market-multiple view that screens it as overvalued on earnings. The Excess Returns intrinsic value estimate points to a discount, while the high P/E suggests investors already pay up for each dollar of reported profit. Broader checks look weak overall despite the single intrinsic value signal. The key question is whether future returns and funding costs eventually support that intrinsic value, or whether the current multiple proves too rich for the risk involved.
This article by Simply Wall St is general in nature. We provide commentary based on historical data and analyst forecasts only using an unbiased methodology and our articles are not intended to be financial advice. It does not constitute a recommendation to buy or sell any stock, and does not take account of your objectives, or your financial situation. We aim to bring you long-term focused analysis driven by fundamental data. Note that our analysis may not factor in the latest price-sensitive company announcements or qualitative material. Simply Wall St has no position in any stocks mentioned.
Have feedback on this article? Concerned about the content? Get in touch with us directly. Alternatively, email editorial-team@simplywallst.com