
Suzuken (TSE:9987), Why Is Its Latest Update Drawing Attention?
Why Suzuken stock is in focus after earnings, guidance and plant suspension
Suzuken (TSE:9987) has drawn fresh attention after first quarter results showed higher sales alongside lower net income, updated earnings and dividend guidance, and an earthquake related suspension at a key manufacturing facility.
See our latest analysis for Suzuken.
At a share price of ¥5,020, Suzuken has seen short term share price returns of 2.28% over the past week but a year to date share price decline of 19.24%. The 5 year total shareholder return of 68.81% points to materially stronger long run outcomes and suggests recent momentum has faded.
If Suzuken's recent moves have you thinking about where else capital might work harder, this could be a good moment to broaden your search and check out 11 top founder-led companies
Suzuken now sits lower year to date despite years of stronger total returns, which leaves a simple puzzle: Has most of the easy upside already played out, or is the recent weakness still opening the door to value?
Preferred P/E multiple of 9x for Suzuken, is it justified?
On a P/E of 9x, Suzuken screens as inexpensive relative to both the wider Japanese healthcare sector and closer peers, based on the latest snapshot of earnings and price.
The P/E multiple compares Suzuken's share price of ¥5,020 to its earnings per share and shows how much investors are paying for each unit of profit. For a large pharmaceutical distributor with steady revenue growth of 2.9% a year and positive earnings growth, this metric helps you judge whether the market is placing a rich or modest price on its profit stream.
Right now the stock trades on a lower P/E than both the JP Healthcare industry average of 13.8x and the peer average of 13.4x. It also sits below the estimated fair P/E of 17x that the fair ratio model points to as a level the market could move towards if conditions supported it. Put together with the indication that Suzuken is trading at 65.9% below an internal fair value estimate, the current multiple suggests the market is pricing its earnings more cautiously than those benchmarks.
Explore the SWS fair ratio for Suzuken
Result: Price-to-Earnings of 9x (UNDERVALUED)
However, Suzuken still faces clear risks, including earthquake related disruption to its facilities and relatively modest annual net income growth of 0.3%, which could restrain sentiment.
Find out about the key risks to this Suzuken narrative.
Another view on Suzuken using the SWS DCF model
The P/E of 9x paints Suzuken as inexpensive, yet the SWS DCF model points to a very different picture. At a share price of ¥5,020 and an estimated future cash flow value of ¥14,718.67, the stock screens as heavily undervalued on cash flows. That raises a simple question for investors: Is this a value gap or a sign the market is worried about longer term earnings quality?
Look into how the SWS DCF model arrives at its fair value.
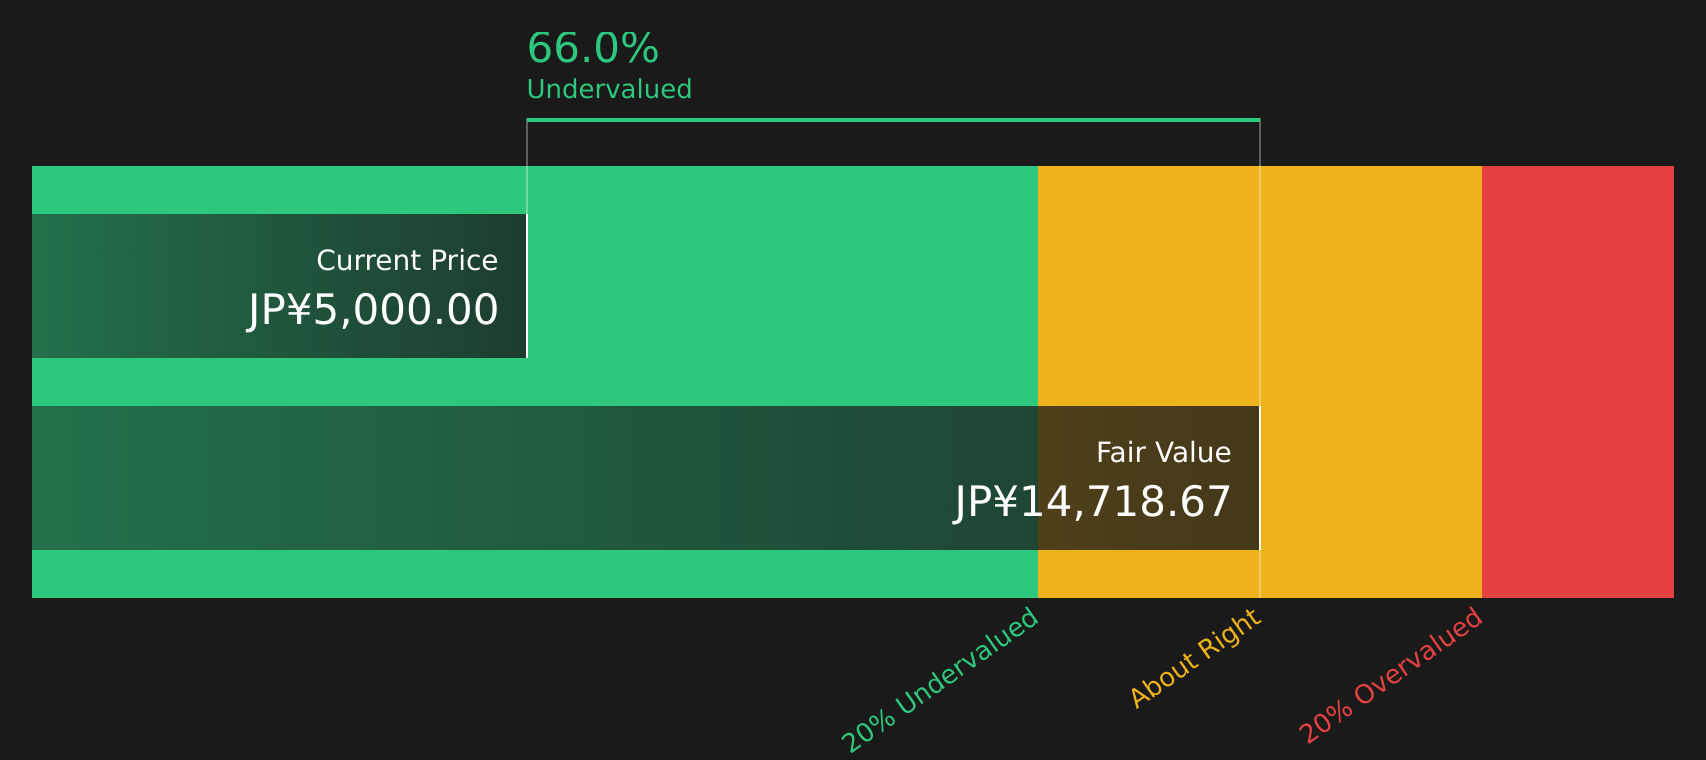
Simply Wall St performs a discounted cash flow (DCF) on every stock in the world every day (check out Suzuken for example). We show the entire calculation in full. You can track the result in your watchlist or portfolio and be alerted when this changes, or use our stock screener to discover 22 high quality undervalued stocks. If you save a screener we even alert you when new companies match - so you never miss a potential opportunity.
Next Steps
If the mixed signals on Suzuken have you unsure which way to lean, this is the time to review the full picture yourself and weigh up both sides. To see how the current data balances 1 or more potential risks against 1 or more possible rewards, take a closer look at the 4 key rewards and 1 important warning sign
Looking for more Suzuken investment ideas?
If Suzuken has sharpened your focus on where capital works hardest, do not stop here. Use the Simply Wall St screener to spot other opportunities before they move.
- Target steadier returns by checking companies with low risk scores through the 52 resilient stocks with low risk scores.
- Hunt for stronger value by assessing companies that appear underpriced on fundamentals using the 22 high quality undervalued stocks.
- Strengthen portfolio resilience by reviewing companies with solid balance sheets and fundamentals in the solid balance sheet and fundamentals stocks screener (41 results).
This article by Simply Wall St is general in nature. We provide commentary based on historical data and analyst forecasts only using an unbiased methodology and our articles are not intended to be financial advice. It does not constitute a recommendation to buy or sell any stock, and does not take account of your objectives, or your financial situation. We aim to bring you long-term focused analysis driven by fundamental data. Note that our analysis may not factor in the latest price-sensitive company announcements or qualitative material. Simply Wall St has no position in any stocks mentioned.
Have feedback on this article? Concerned about the content? Get in touch with us directly. Alternatively, email editorial-team@simplywallst.com