
Do Imperial Metals’ (TSX:III) Compressed EPS Figures Hint At Shifting Profitability Dynamics?
- Imperial Metals Corporation has reported past results for the second quarter and six months ended June 30, 2026, with sales of C$166.52 million and net income of C$21.98 million for the quarter, and C$321.09 million in sales and C$36.38 million in net income for the half-year, all lower than the prior-year period.
- An interesting aspect of these results is the sharp contraction in earnings per share from continuing operations, falling to C$0.12 for the quarter and C$0.20 for the half-year, compared with C$0.25 and C$0.50 a year earlier.
- Against this backdrop of weaker earnings, we will explore how the compressed earnings per share figures influence Imperial Metals’ broader investment narrative.
Invest in the nuclear renaissance through our list of 90 elite nuclear energy infrastructure plays powering the global AI revolution.
What Is Imperial Metals' Investment Narrative?
For anyone considering Imperial Metals, the big picture rests on confidence in its core copper and gold assets, particularly Red Chris, transitioning to a long-life block cave backed by federal and provincial support. The latest quarter complicates that story. Earnings and margins have pulled back, with weaker production at both Red Chris and Mount Polley feeding straight through to compressed EPS, even as the share price has sprinted higher over the past year. In the near term, that puts more weight on execution at the mines and on how quickly production stabilizes relative to earlier 2026 guidance. The new earnings numbers do not erase the longer-term potential around Red Chris, but they do raise the stakes around cost control, grade variability and the timing of block cave development as key catalysts and risks. However, one operational sensitivity could matter more than recent earnings suggest, and investors should understand it.
Imperial Metals' shares are on the way up, but they could be overextended by 27%. Uncover the fair value now.Exploring Other Perspectives
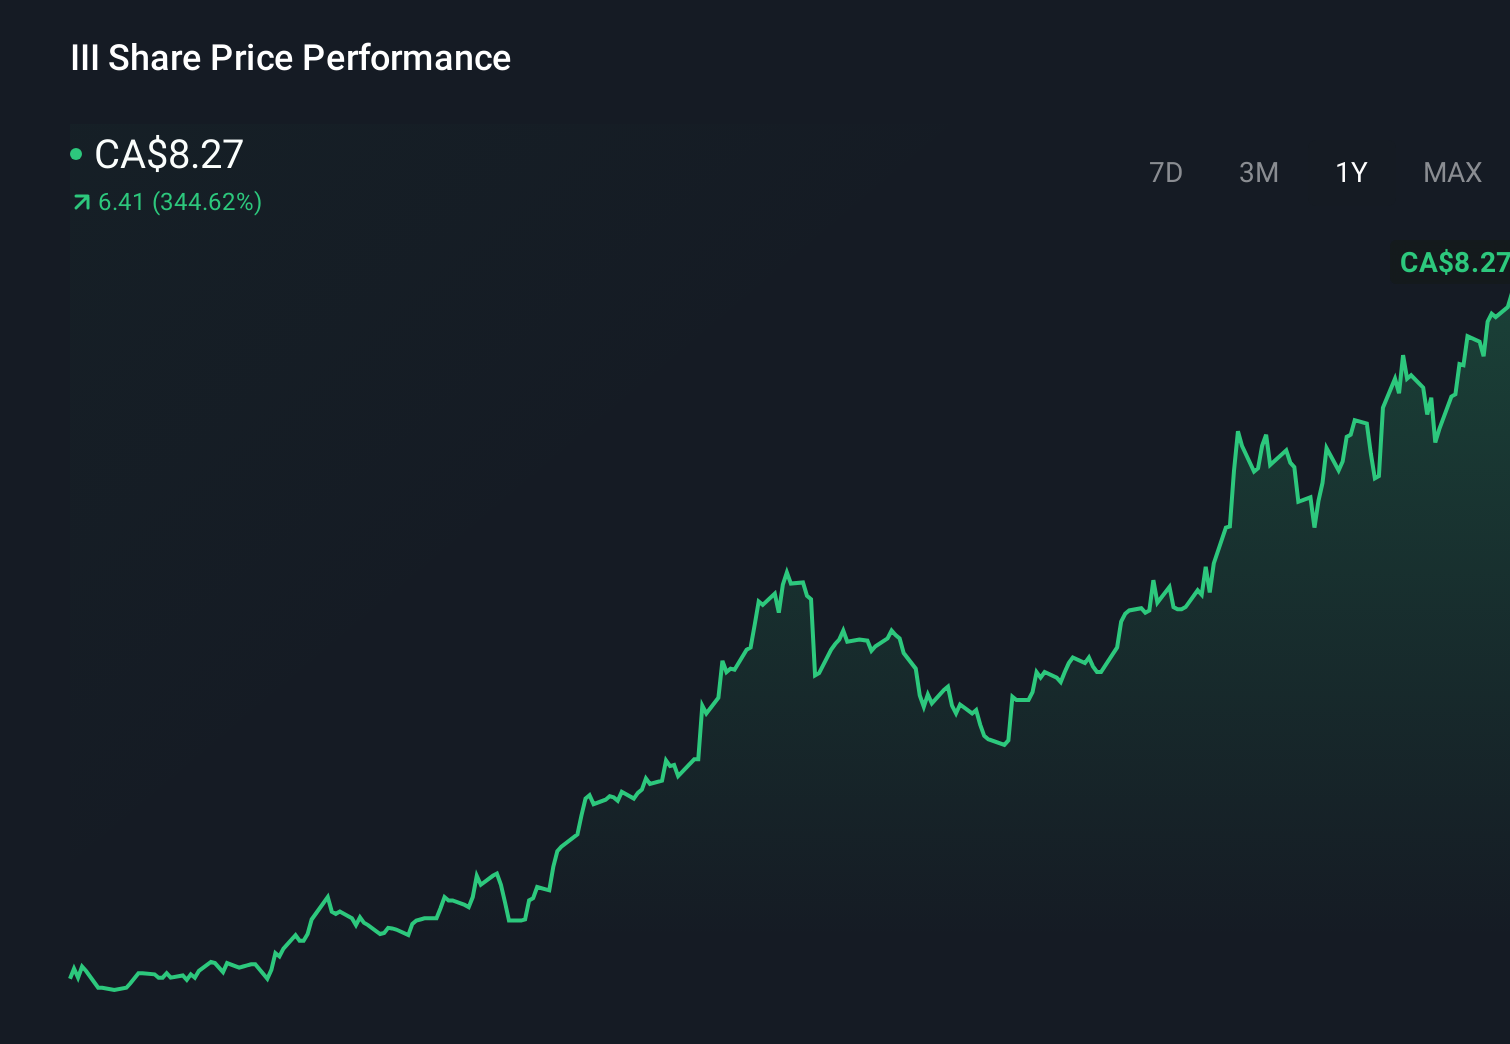
Three Simply Wall St Community fair value views span about C$6.90 to C$27.92, reflecting sharply different expectations. Set that against the recent EPS compression and production slippage to see why opinions diverge on how resilient Imperial’s current performance really is.
Explore 3 other fair value estimates on Imperial Metals - why the stock might be worth 21% less than the current price!
The Verdict Is Yours
Don't just follow the ticker - dig into the data and build a conviction that's truly your own.
- A great starting point for your Imperial Metals research is our analysis highlighting 1 key reward and 1 important warning sign that could impact your investment decision.
- Our free Imperial Metals research report provides a comprehensive fundamental analysis summarized in a single visual - the Snowflake - making it easy to evaluate Imperial Metals' overall financial health at a glance.
Want Some Alternatives?
Early movers are already taking notice. See the stocks they're targeting before they've flown the coop:
- Rare earth metals are an input to most high-tech devices, military and defence systems and electric vehicles. The global race is on to secure supply of these critical minerals. Beat the pack to uncover the 28 best rare earth metal stocks of the very few that mine this essential strategic resource.
- Explore 25 top quantum computing companies leading the revolution in next-gen technology and shaping the future with breakthroughs in quantum algorithms, superconducting qubits, and cutting-edge research.
- The best AI stocks today may lie beyond giants like Nvidia and Microsoft. Find the next big opportunity with these 16 smaller AI-focused companies with strong growth potential through early-stage innovation in machine learning, automation, and data intelligence that could fund your retirement.
This article by Simply Wall St is general in nature. We provide commentary based on historical data and analyst forecasts only using an unbiased methodology and our articles are not intended to be financial advice. It does not constitute a recommendation to buy or sell any stock, and does not take account of your objectives, or your financial situation. We aim to bring you long-term focused analysis driven by fundamental data. Note that our analysis may not factor in the latest price-sensitive company announcements or qualitative material. Simply Wall St has no position in any stocks mentioned.
Have feedback on this article? Concerned about the content? Get in touch with us directly. Alternatively, email editorial-team@simplywallst.com