
Lenzing (WBAG:LNZ) Could Be 74% Undervalued After Q2 Losses Narrowed
Lenzing (WBAG:LNZ) stock is back in focus after the company reported second quarter results that showed a sharply lower net loss and called an Extraordinary General Meeting to vote on a proposed capital increase.
See our latest analysis for Lenzing.
At a share price of €23.1, Lenzing’s recent 7 day share price return of 4.55% and year to date share price return of 3.55% contrast with a 1 year total shareholder return that has fallen 12.83%. This suggests improving sentiment but a still weak longer term experience for holders.
If you are weighing Lenzing’s recent swing back into focus, it may also be a good time to broaden your watchlist with 102 top founder-led companies
Lenzing’s recent share move sits between signs of operational improvement and investors simply re-rating the stock ahead of a potential capital increase. How does that balance look when it is compared with the current valuation metrics?
Preferred Price-to-Sales Multiple of 0.4x: Is it justified?
Lenzing is currently trading on a P/S ratio of 0.4x, while the SWS DCF model estimates a fair value of €89.73 per share compared with the last close of €23.6. That combination points to a stock that screens as cheap on some measures yet still carries questions around its fundamentals.
The P/S ratio compares the company’s share price to its annual revenue per share. It is often used for businesses like Lenzing that are currently loss making, because earnings do not yet give a clean picture. A lower P/S ratio can signal that the market is applying a discount to the company’s revenue base.
On that front, Lenzing stands out. The stock is described as good value on a P/S of 0.4x compared with a peer average of 1.3x and a European chemicals industry average of 1.1x. However, the same data labels Lenzing as expensive against an estimated fair P/S ratio of 0.3x, which is the level the market could move towards if that fair ratio became the reference point.
Investors are also given a DCF anchor for that discussion. The SWS DCF model suggests Lenzing is trading at a 73.7% discount to an estimated future cash flow value of €89.73, and one statement summarises this as trading at 73.7% below an estimate of fair value.
That mix of signals sits against a challenging profitability profile. Lenzing reported a loss of €179.1m, has a negative return on equity of 12.18%, and is assessed as currently unprofitable with losses that have increased over the past 5 years at a rate of 33% per year. Analyst forecasts in the data indicate Lenzing is expected to remain unprofitable over the next 3 years, with revenue forecast to grow by 2.9% per year, which is slower than both the Austrian market at 4% per year and the 20% high growth threshold used in the checks.
On top of that, the stock’s recent experience has been difficult for longer term holders. The 1 year total shareholder return declined 12.83%, while 3 year and 5 year total returns fell 45.20% and 74.78% respectively, and the share price is described as more volatile than the wider Austrian market over the past 3 months. The company’s funding structure is also tilted entirely to what the checks call higher risk sources of funding, since 100% of liabilities are external borrowing rather than customer deposits.
There are some points in Lenzing’s profile that may interest investors who are comfortable with this kind of risk reward profile. Revenue growth over the most recent year is stated at 2.94% and net income growth at a very large rate from a low base, though the company is still unprofitable. The board is described as experienced with an average tenure of 3.3 years and has added three new directors over the last 3 years, while the management team is relatively new with an average tenure of 1.2 years.
For investors comparing these valuation signals against market expectations, the analyst price target in the data is €24.7 per share, only around 7% higher than the current share price, and one check flags that the target price is less than 20% higher than the current share price.
Explore the SWS fair ratio for Lenzing
Result: Price-to-Sales ratio of 0.4x (UNDERVALUED)
However, Lenzing still carries clear risks, including ongoing losses of €179.1m and a funding mix that relies entirely on external borrowing, which could pressure any recovery narrative.
Find out about the key risks to this Lenzing narrative.
Another view on Lenzing’s value
While the low P/S ratio paints Lenzing as cheap compared with peers, the SWS DCF model goes much further. It estimates a future cash flow value of €89.73 per share versus a current price of €23.1, which suggests a wide gap investors need to interpret carefully.
That kind of difference raises a practical question. Is the market being too cautious about Lenzing’s loss making profile, or is the DCF model assigning too much value to future cash flows that may be hard to realise?
Look into how the SWS DCF model arrives at its fair value.
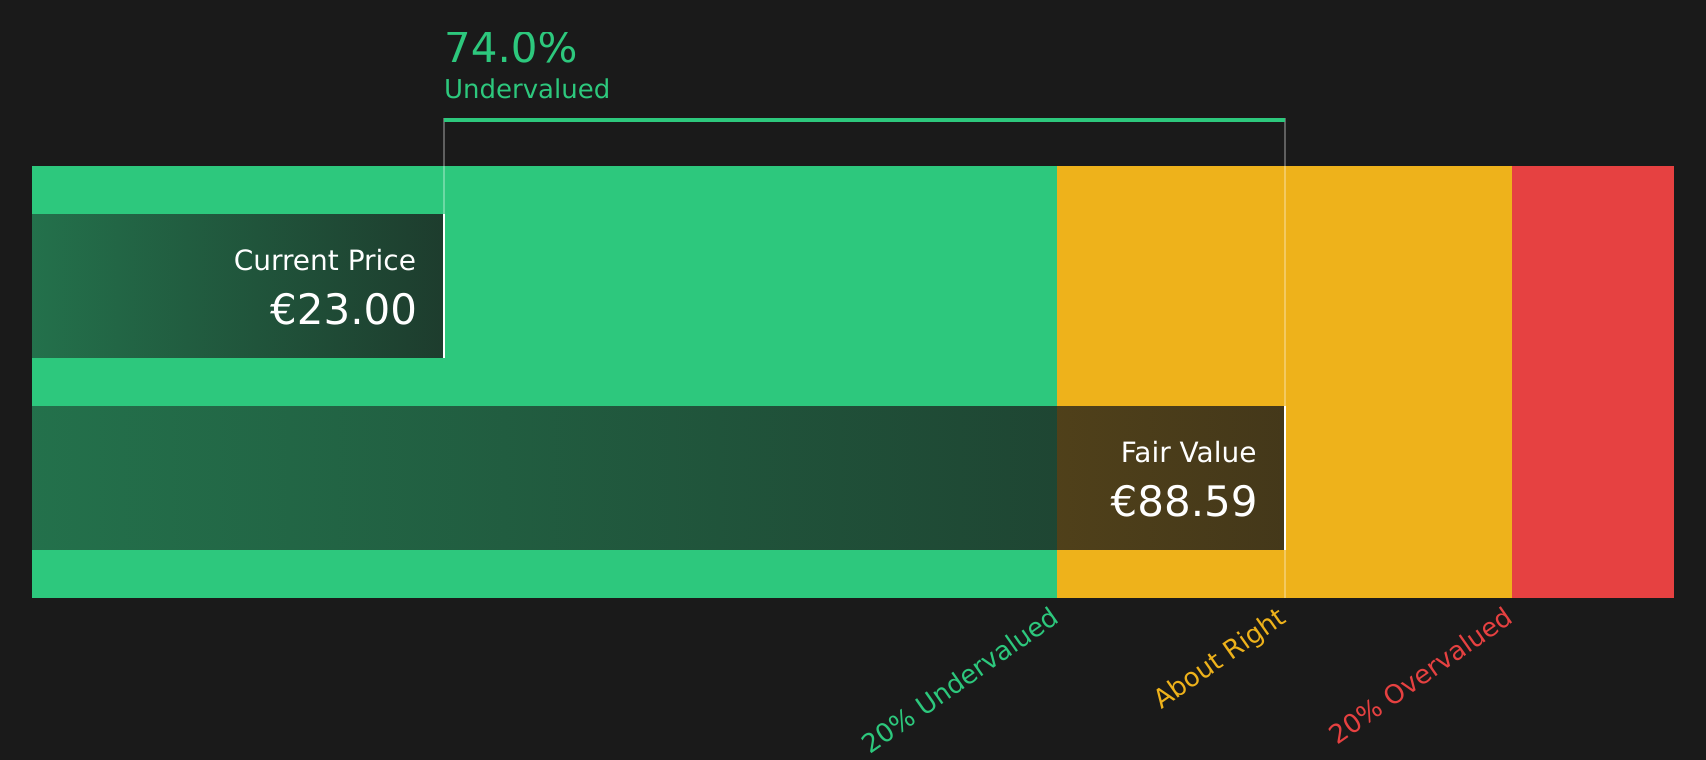
Simply Wall St performs a discounted cash flow (DCF) on every stock in the world every day (check out Lenzing for example). We show the entire calculation in full. You can track the result in your watchlist or portfolio and be alerted when this changes, or use our stock screener to discover 253 high quality undervalued stocks. If you save a screener we even alert you when new companies match - so you never miss a potential opportunity.
Next Steps
Given the mixed picture around Lenzing’s value and risk profile, it makes sense to look directly at the underlying data before forming a view. If you want a quick snapshot of how the risk and reward signals balance out for this stock, start by reviewing the 1 key reward and 2 important warning signs.
Looking for more investment ideas beyond Lenzing?
If Lenzing has your attention, it is also worth lining up a few fresh candidates so you are not relying on a single stock for opportunity.
- Spot potential bargains early by scanning screener containing 584 high quality undiscovered gems that combine solid fundamentals with less crowded investor attention.
- Strengthen your portfolio’s foundation by checking out the solid balance sheet and fundamentals stocks screener (429 results) that can help support resilience through different market conditions.
- Dial back overall portfolio stress by reviewing 292 resilient stocks with low risk scores that score well on key risk indicators while still offering room for upside.
This article by Simply Wall St is general in nature. We provide commentary based on historical data and analyst forecasts only using an unbiased methodology and our articles are not intended to be financial advice. It does not constitute a recommendation to buy or sell any stock, and does not take account of your objectives, or your financial situation. We aim to bring you long-term focused analysis driven by fundamental data. Note that our analysis may not factor in the latest price-sensitive company announcements or qualitative material. Simply Wall St has no position in any stocks mentioned.
Have feedback on this article? Concerned about the content? Get in touch with us directly. Alternatively, email editorial-team@simplywallst.com