
National Vision Holdings (EYE) Stock May Be Below Fair Value As Shares Fell 65%
National Vision Holdings has been a weak performer over the long run, with the share price down about 64.6% over the past five years, yet the current valuation picture is mixed because the Discounted Cash Flow (DCF) intrinsic value suggests meaningful upside while market based multiples point the other way.
- The roughly 64.6% share price decline over five years signals that investors have reassessed National Vision Holdings and currently place a much lower value on the business than in the past.
- Future revenue growth and cash flow conversion can support the DCF case for upside. However, any pressure on margins or higher capital needs may weaken that intrinsic value argument.
- With a value score of only 2 out of 6, National Vision Holdings does not screen as a clear bargain on the broader valuation checks, even though the DCF points to it trading around 37.3% below intrinsic value and market multiples suggest the stock is expensive.
The issue now is whether National Vision Holdings is closer to the intrinsic value suggested by the DCF work or to the richer picture implied by its earnings and revenue multiples.
Find out why National Vision Holdings' -16.0% return over the last year is lagging behind its peers.
Is National Vision Holdings a Bargain on Cash Flow?
The Discounted Cash Flow (DCF) approach estimates what National Vision Holdings might be worth based on its future cash generation. For the latest twelve months, the company produced free cash flow of about $78.4 million, and the model assumes that free cash flow grows from this base over time rather than shrinking.
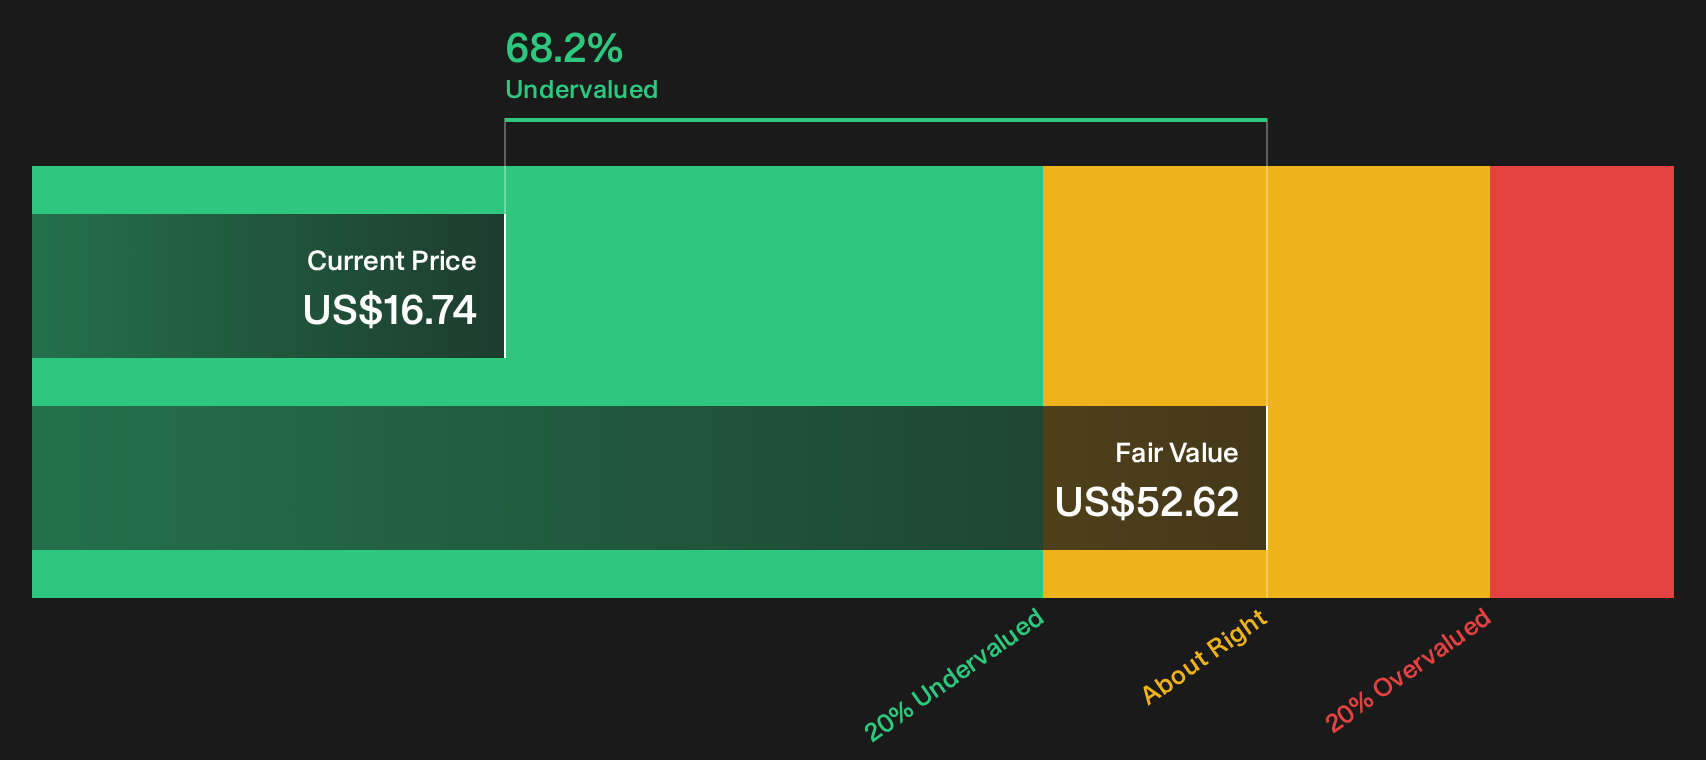
On these projections, the 2 Stage Free Cash Flow to Equity model points to an intrinsic value of about $31 per share. Against the current market price, that implies the stock trades at roughly a 37.3% discount to the modelled value. This gap reflects the market taking a more cautious stance than the DCF suggests on how durable and scalable National Vision Holdings' cash flows will be.
On balance, the DCF work indicates that National Vision Holdings stock appears undervalued relative to the model’s estimates.
Our Discounted Cash Flow (DCF) analysis suggests National Vision Holdings is undervalued by 37.3%. Track this in your watchlist or portfolio, or discover 49 more high quality undervalued stocks.
Does National Vision Holdings Look Pricey on Earnings?
The P/E ratio is often a useful way to compare National Vision Holdings with other listed retailers that already generate earnings. National Vision Holdings currently trades on a P/E of about 33.5x, which is well above the Specialty Retail industry average of about 19.8x and also above the peer average of roughly 14.7x.
A fair P/E based on National Vision Holdings' profile is estimated at around 23.8x. That sits meaningfully below the current 33.5x level, which suggests investors are paying a higher price for each dollar of earnings than both the model and broader peer group would typically justify. This points to expectations that are richer than what the benchmark ratio implies.
On this earnings multiple, National Vision Holdings stock appears overvalued compared with both its tailored fair P/E and sector benchmarks.

See what the numbers say about this price — find out in our valuation breakdown.
The National Vision Holdings Narrative: What Would Justify Today's Price?
Simply Wall St Narratives for National Vision Holdings pick up from this valuation split and set out what would need to happen with the company’s growth, margins and earnings for the stock to be worth materially more or less than today’s price, based on scenarios shared on the Community page. Instead of relying on a single multiple or model, each narrative explains the assumptions behind its fair value so you can compare them with actual results over time.
One of the top community narratives on National Vision Holdings: 33% undervalued
"Store fleet rationalization and targeted new store openings, combined with leveraging remote exam technology, are driving operational efficiencies and improved store productivity…"
Read one of the top narratives on National Vision Holdings
Do you think there's more to the story for National Vision Holdings? Head over to our Community to see what others are saying!
The Bottom Line
National Vision Holdings sits at an awkward crossroads. The Discounted Cash Flow (DCF) work points to meaningful intrinsic value upside, yet the current P/E multiple suggests the stock is overvalued compared with peers and a tailored fair ratio. The low overall value score reinforces how fragile that DCF support can be if cash flow timing, capital needs or margins disappoint. The key question from here is whether future growth and profitability validate the richer multiple or whether the current discount to intrinsic value turns out to be a value trap.
This article by Simply Wall St is general in nature. We provide commentary based on historical data and analyst forecasts only using an unbiased methodology and our articles are not intended to be financial advice. It does not constitute a recommendation to buy or sell any stock, and does not take account of your objectives, or your financial situation. We aim to bring you long-term focused analysis driven by fundamental data. Note that our analysis may not factor in the latest price-sensitive company announcements or qualitative material. Simply Wall St has no position in any stocks mentioned.
Have feedback on this article? Concerned about the content? Get in touch with us directly. Alternatively, email editorial-team@simplywallst.com