
Is TMX Group’s Higher Q2 Earnings And Dividend Hike Altering The Investment Case For TMX Group (TSX:X)?
- TMX Group’s Board of Directors increased its quarterly dividend to C$0.26 per common share and, for the second quarter of 2026, reported sales of C$487.5 million and net income of C$142.6 million, both higher than the same period a year earlier.
- Across the first half of 2026, TMX Group’s higher revenue and earnings, combined with an 8% dividend increase, point to stronger cash generation and management’s confidence in the company’s financial position.
- We’ll now examine how TMX Group’s stronger earnings and dividend increase could influence its existing investment narrative and future expectations.
Find 8 companies with promising cash flow potential yet trading below their fair value.
TMX Group Investment Narrative Recap
To own TMX Group, you need to believe that public capital markets in Canada will remain central to equity financing and trading activity, and that TMX can defend its position against global exchanges and alternative funding channels. The strong Q2 2026 earnings and higher dividend reinforce the near term earnings and cash generation story, but they do not materially change the key catalyst of listing and trading activity volumes, or the structural risk from rising competition and new market structures.
The dividend increase to C$0.26 per share and robust first half 2026 earnings sit alongside TMX’s normal course issuer bid, which authorizes repurchases of up to 2,800,000 shares. Together, these actions highlight how TMX is currently using its balance sheet and cash flow, which ties directly into the debate around how sustainable its capital return profile is if competition for listings intensifies or domestic trading volumes soften.
Yet investors should also be aware that growing competition from larger global exchanges could...
Read the full narrative on TMX Group (it's free!)
TMX Group's narrative projects CA$2.3 billion revenue and CA$752.4 million earnings by 2029. This requires 9.1% yearly revenue growth and a CA$218.0 million earnings increase from CA$534.4 million today.
Uncover how TMX Group's forecasts yield a CA$65.03 fair value, a 20% upside to its current price.
Exploring Other Perspectives
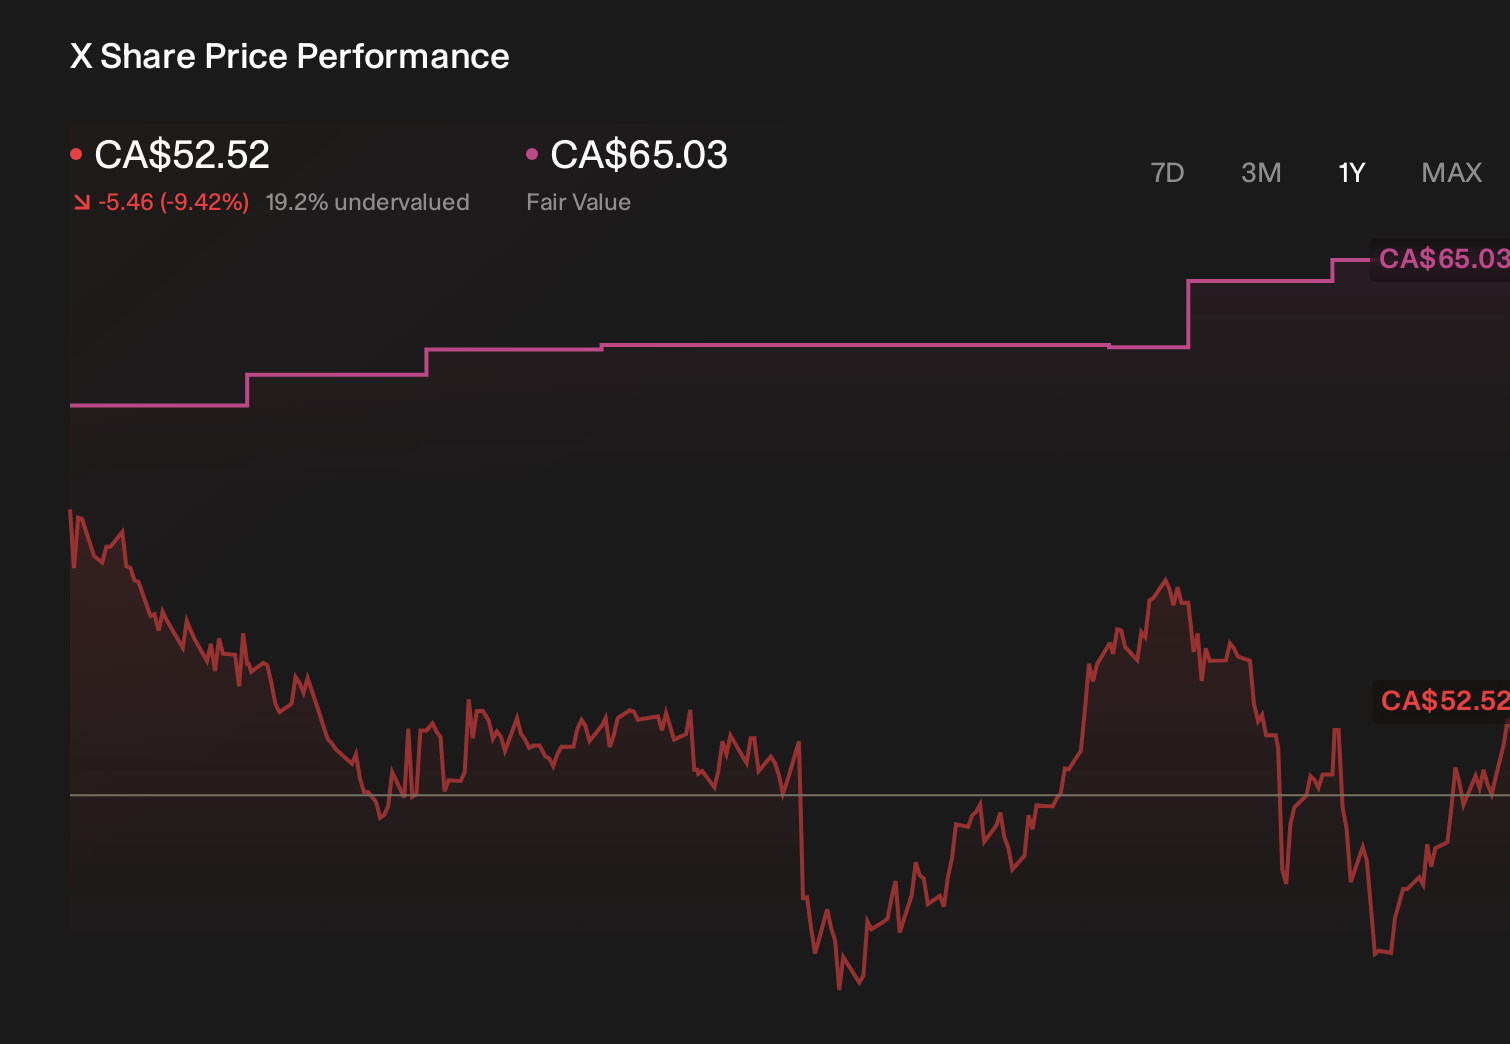
Five members of the Simply Wall St Community value TMX Group between C$30.84 and C$65.58, underscoring how far opinions can differ. Set this against TMX’s reliance on public listings and trading volumes, and you can see why it is worth exploring several alternative viewpoints on the company’s prospects.
Explore 5 other fair value estimates on TMX Group - why the stock might be worth 43% less than the current price!
Form Your Own Verdict
Don't just follow the ticker - dig into the data and build a conviction that's truly your own.
- A great starting point for your TMX Group research is our analysis highlighting 4 key rewards that could impact your investment decision.
- Our free TMX Group research report provides a comprehensive fundamental analysis summarized in a single visual - the Snowflake - making it easy to evaluate TMX Group's overall financial health at a glance.
Looking For Alternative Opportunities?
Early movers are already taking notice. See the stocks they're targeting before they've flown the coop:
- The future of work is here. Discover the 39 top robotics and automation stocks leading the charge in AI-driven automation and industrial transformation.
- We've uncovered the 4 dividend fortresses yielding 5%+ that don't just survive market storms, but thrive in them.
- The latest GPUs need a type of rare earth metal called Neodymium and there are only 28 companies in the world exploring or producing it. Find the list for free.
This article by Simply Wall St is general in nature. We provide commentary based on historical data and analyst forecasts only using an unbiased methodology and our articles are not intended to be financial advice. It does not constitute a recommendation to buy or sell any stock, and does not take account of your objectives, or your financial situation. We aim to bring you long-term focused analysis driven by fundamental data. Note that our analysis may not factor in the latest price-sensitive company announcements or qualitative material. Simply Wall St has no position in any stocks mentioned.
Have feedback on this article? Concerned about the content? Get in touch with us directly. Alternatively, email editorial-team@simplywallst.com