
Loews (L) Affirms Dividend And Earnings, Is The Stock Fully Valued?
Dividend affirmation and earnings update put Loews in focus
Loews (L) has drawn fresh attention after affirming a quarterly dividend of $0.0625 per share and releasing second quarter 2026 results, along with an update on its long running share buyback program.
See our latest analysis for Loews.
At a share price of $112.72, Loews has seen short term momentum cool, with the share price down 2.81% over the past week. However, the 1 year total shareholder return of 18.21% and 5 year total shareholder return of 109.64% show a stronger long term trend that frames the latest dividend, earnings update and ongoing buybacks as part of a longer running compounding story.
If this mix of income, buybacks and long term compounding appeals, it can be useful to look at other companies with similar depth of ownership and focus by checking out 20 top founder-led companies
After a strong multi year run and a softer recent pullback, the question around Loews now shifts. Is most of the easy gain already reflected in the price, or does the current valuation still leave meaningful upside ahead?
Price to earnings of 13.7x for Loews, is it justified?
Loews currently trades on a P/E of 13.7x, which sits above both its peer group on 10.3x and the wider US Insurance industry on 11.3x.
The P/E ratio compares the share price to earnings per share. For an insurance focused group like Loews, it gives a quick read on how much investors are paying for each dollar of current earnings, relative to similar companies.
With the stock above the peer and industry averages, the market is attaching a higher earnings multiple to Loews than to comparable insurers. That premium sits alongside an SWS DCF model estimate of future cash flow value at $109.41, slightly below the current $112.72 share price. On that framework, this points to limited implied upside.
Compared with the US Insurance industry average P/E of 11.3x, Loews trades on a meaningfully richer multiple. Against its closest peers at 10.3x, the gap is even wider, which may signal that investors are comfortable paying more for its earnings stream than for the sector as a whole.
See what the numbers say about this price — find out in our valuation breakdown.
Result: Price-to-earnings of 13.7x (OVERVALUED)
However, Loews still faces risks if insurance underwriting conditions weaken or if its diversified units, such as pipelines or hotels, experience pressure on earnings or cash flow.
Find out about the key risks to this Loews narrative.
Another view on Loews using cash flows
The P/E multiple paints Loews as expensive relative to insurers, yet the SWS DCF model points to a future cash flow value of $109.41, only slightly below the current $112.72 share price. That is closer to fairly valued than stretched. Which signal should carry more weight for you as an investor?
For a closer look at how this cash flow view is built, and what assumptions sit underneath it, Look into how the SWS DCF model arrives at its fair value.
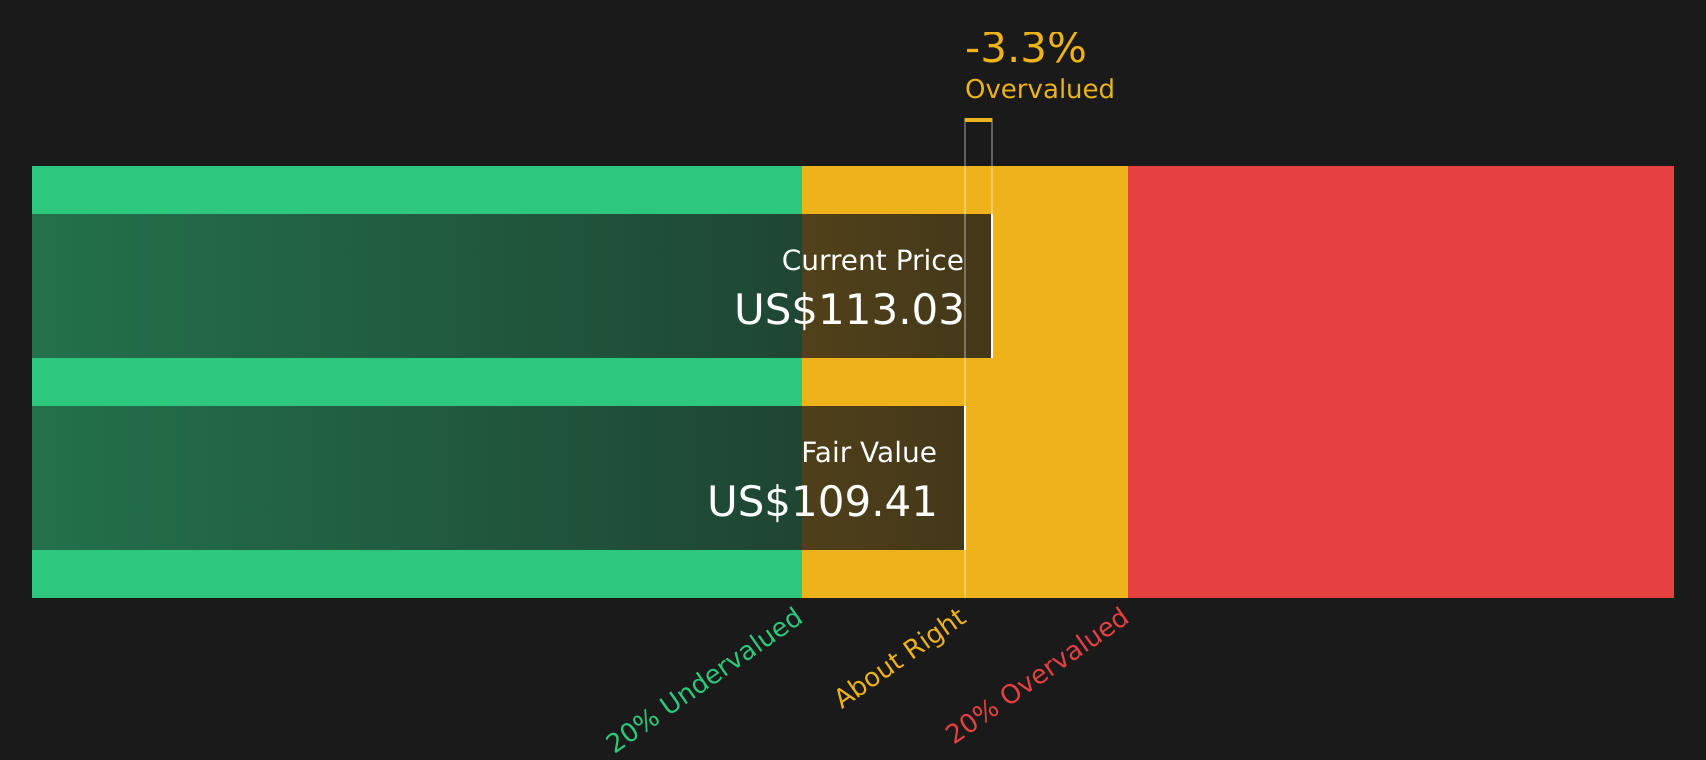
Simply Wall St performs a discounted cash flow (DCF) on every stock in the world every day (check out Loews for example). We show the entire calculation in full. You can track the result in your watchlist or portfolio and be alerted when this changes, or use our stock screener to discover 51 high quality undervalued stocks. If you save a screener we even alert you when new companies match - so you never miss a potential opportunity.
Next Steps
If the mixed signals around Loews leave you unsure, review the underlying reward drivers now and decide where you stand. Start by reviewing the 2 key rewards
Looking for more investment ideas beyond Loews?
If Loews has sharpened your focus on quality, do not stop here. Broaden your watchlist now so you are not chasing opportunities after they move.
- Spot income potential by reviewing companies that feature 11 dividend fortresses and see which yields might suit a long term portfolio.
- Hunt for quality at sensible prices with 51 high quality undervalued stocks that combine fundamentals with the possibility of mispriced expectations.
- Strengthen your downside protection by checking 88 resilient stocks with low risk scores that aim to keep volatility and financial risk in check.
This article by Simply Wall St is general in nature. We provide commentary based on historical data and analyst forecasts only using an unbiased methodology and our articles are not intended to be financial advice. It does not constitute a recommendation to buy or sell any stock, and does not take account of your objectives, or your financial situation. We aim to bring you long-term focused analysis driven by fundamental data. Note that our analysis may not factor in the latest price-sensitive company announcements or qualitative material. Simply Wall St has no position in any stocks mentioned.
Have feedback on this article? Concerned about the content? Get in touch with us directly. Alternatively, email editorial-team@simplywallst.com