
What Is Drawing Attention To SoftBank Group (TSE:9984) Today?
SoftBank Group (TSE:9984) is back in focus after reporting first quarter earnings for the period ended June 30, 2026, with higher sales but lower net income and earnings per share year on year.
See our latest analysis for SoftBank Group.
Over the past month SoftBank Group’s share price return fell 15.2%, although the year to date share price return is 20.8% and the 1 year total shareholder return is 44.01%, with multi year total shareholder returns also remaining very strong.
If SoftBank Group’s mix of telecoms, AI and investment exposure has your attention, this can be a good moment to look across similar opportunities in listed AI infrastructure and hardware companies using the 55 AI infrastructure stocks
After a sharp pullback yet still strong multi year returns, SoftBank Group now trades at a discount to both analyst targets and some intrinsic value estimates. Where might a realistic fair value lie within that range?
Preferred P/E of 6.5x for SoftBank Group, is it justified?
Based on the current P/E of 6.5x and the recent close at ¥5,575, SoftBank Group screens as undervalued compared to both its own fair multiple and sector peers.
The P/E ratio compares the share price with earnings per share. For a company like SoftBank Group that combines telecoms, AI and investment activities, P/E gives a quick read on how the market is pricing its earnings profile.
SoftBank Group is described as good value on several fronts. The stock trades on a P/E of 6.5x, which is below the estimated fair P/E of 10x that our fair ratio model suggests could be more appropriate. It also sits well below the Asian Wireless Telecom industry average of 17.7x and the direct peer average of 18.3x. That points to a sizeable gap between how the market is valuing SoftBank Group’s earnings and how similar companies are currently valued and where the fair ratio indicates the multiple could move.
Explore the SWS fair ratio for SoftBank Group.
Result: Price-to-earnings of 6.5x (UNDERVALUED)
However, SoftBank Group’s investment heavy model and the sharp annual decline in net income growth of 45% could both challenge the speed at which that valuation gap closes.
Find out about the key risks to this SoftBank Group narrative.
Another view on SoftBank Group’s value
While the P/E comparison leans toward SoftBank Group looking cheap, our DCF model is more restrained. The shares trade at ¥5,575, around 9.2% below an estimated future cash flow value of ¥6,137.01. That still points to upside, but is the margin of safety enough?
Look into how the SWS DCF model arrives at its fair value.
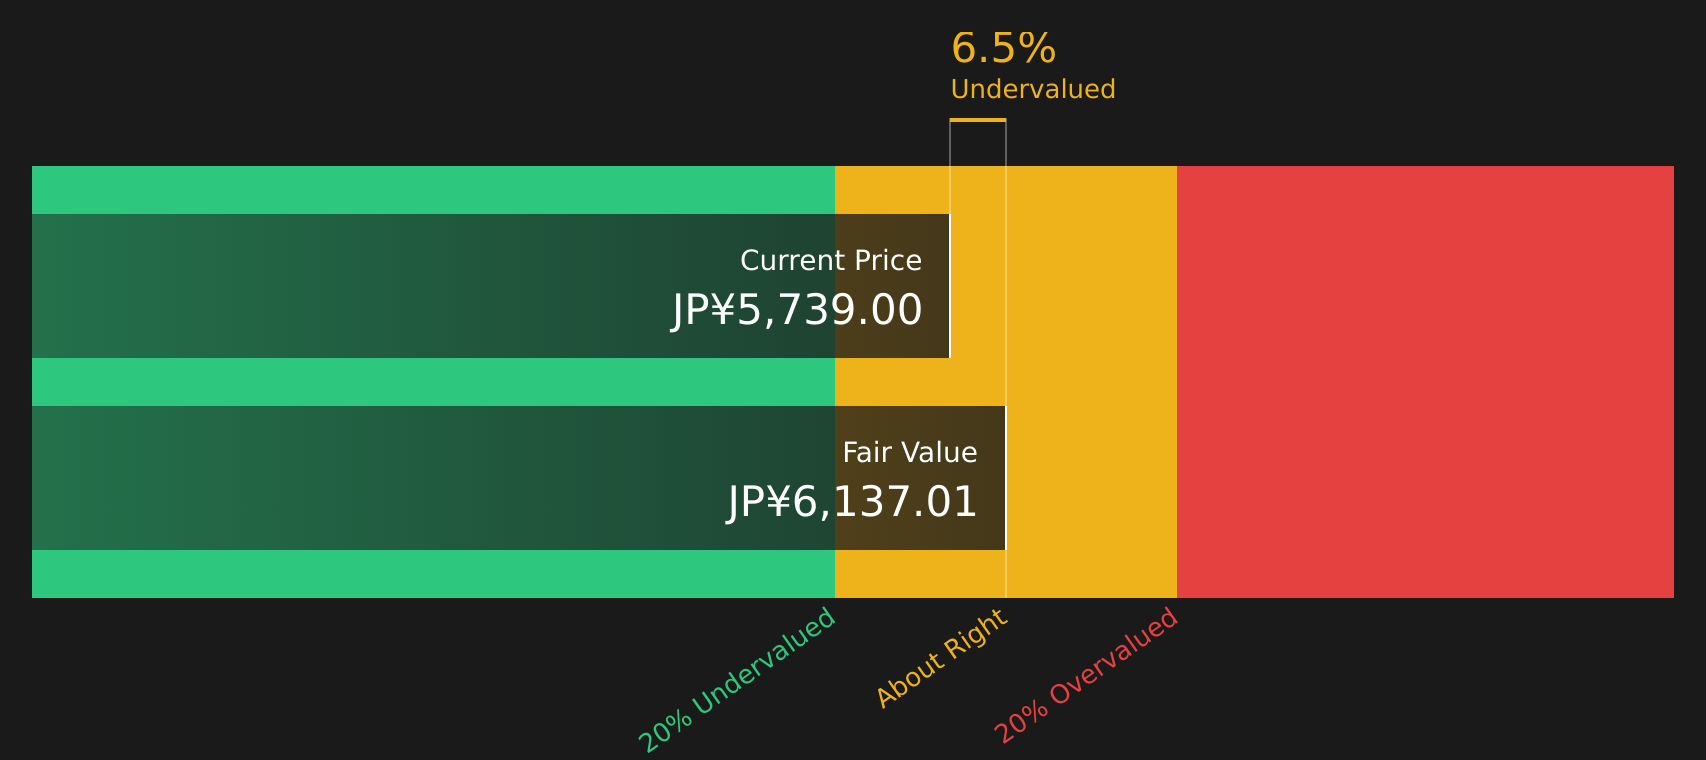
Simply Wall St performs a discounted cash flow (DCF) on every stock in the world every day (check out SoftBank Group for example). We show the entire calculation in full. You can track the result in your watchlist or portfolio and be alerted when this changes, or use our stock screener to discover 23 high quality undervalued stocks. If you save a screener we even alert you when new companies match - so you never miss a potential opportunity.
Next Steps
Mixed signals around SoftBank Group can create urgency, so it makes sense to look through the full set of risks and rewards yourself. For a clearer picture of both sides of the story, start with the 4 key rewards and 4 important warning signs.
Looking for more investment ideas beyond SoftBank Group?
If SoftBank Group has sharpened your interest in new opportunities, do not stop here. Use these focused stock ideas to keep building a portfolio that matches your goals.
- Target robust cash generators by reviewing companies in the 23 high quality undervalued stocks that pair appealing prices with solid fundamentals.
- Build a steadier income stream by checking out the 37 dividend fortresses that offer higher yields with an emphasis on resilience.
- Get ahead of the crowd by researching the screener containing 69 high quality undiscovered gems before attention and capital move elsewhere.
This article by Simply Wall St is general in nature. We provide commentary based on historical data and analyst forecasts only using an unbiased methodology and our articles are not intended to be financial advice. It does not constitute a recommendation to buy or sell any stock, and does not take account of your objectives, or your financial situation. We aim to bring you long-term focused analysis driven by fundamental data. Note that our analysis may not factor in the latest price-sensitive company announcements or qualitative material. Simply Wall St has no position in any stocks mentioned.
Have feedback on this article? Concerned about the content? Get in touch with us directly. Alternatively, email editorial-team@simplywallst.com