
European Penny Stocks To Watch In August 2026
European markets have recently shown resilience, with the pan-European STOXX Europe 600 Index rising by 1.70% amid a backdrop of geopolitical volatility and firming investor risk appetite. In this context, penny stocks—often representing smaller or newer companies—continue to capture interest for their affordability and potential growth opportunities. Despite being considered an outdated term, these stocks remain relevant as they can offer investors access to emerging companies with strong financial foundations that might lead to significant returns over time.
Let's review some notable picks from our screened stocks.
Ferretti (BIT:YACHT)
Simply Wall St Financial Health Rating: ★★★★★★
Overview: Ferretti S.p.A. designs, constructs, markets, and sells yachts and vessels under several brand names including Riva and Ferretti Yachts, with a market cap of approximately €998.52 million.
Operations: The company generates €1.34 billion in revenue from the design, construction, and marketing of yachts and recreational boats.
Market Cap: €998.52M
Ferretti S.p.A. has a market cap of approximately €998.52 million and generates significant revenue from yacht sales, reporting €653.28 million for the first half of 2026, though this marks a decline from the previous year. The company holds more cash than debt and maintains strong asset coverage over both short- and long-term liabilities, indicating financial stability. Despite recent legal challenges that don't impact operations, Ferretti revised its 2026 revenue guidance to between €1.2 billion and €1.24 billion, reflecting cautious optimism amidst leadership changes with a new CEO appointed in May 2026.
- Navigate through the intricacies of Ferretti with our comprehensive balance sheet health report here.
- Explore Ferretti's analyst forecasts in our growth report.
Lhyfe (ENXTPA:LHYFE)
Simply Wall St Financial Health Rating: ★★★★☆☆
Overview: Lhyfe SA is engaged in the production and supply of renewable green hydrogen for mobility and industry markets, with a market cap of €102.88 million.
Operations: The company generates revenue primarily from its Oil & Gas - Exploration & Production segment, amounting to €9.77 million.
Market Cap: €102.88M
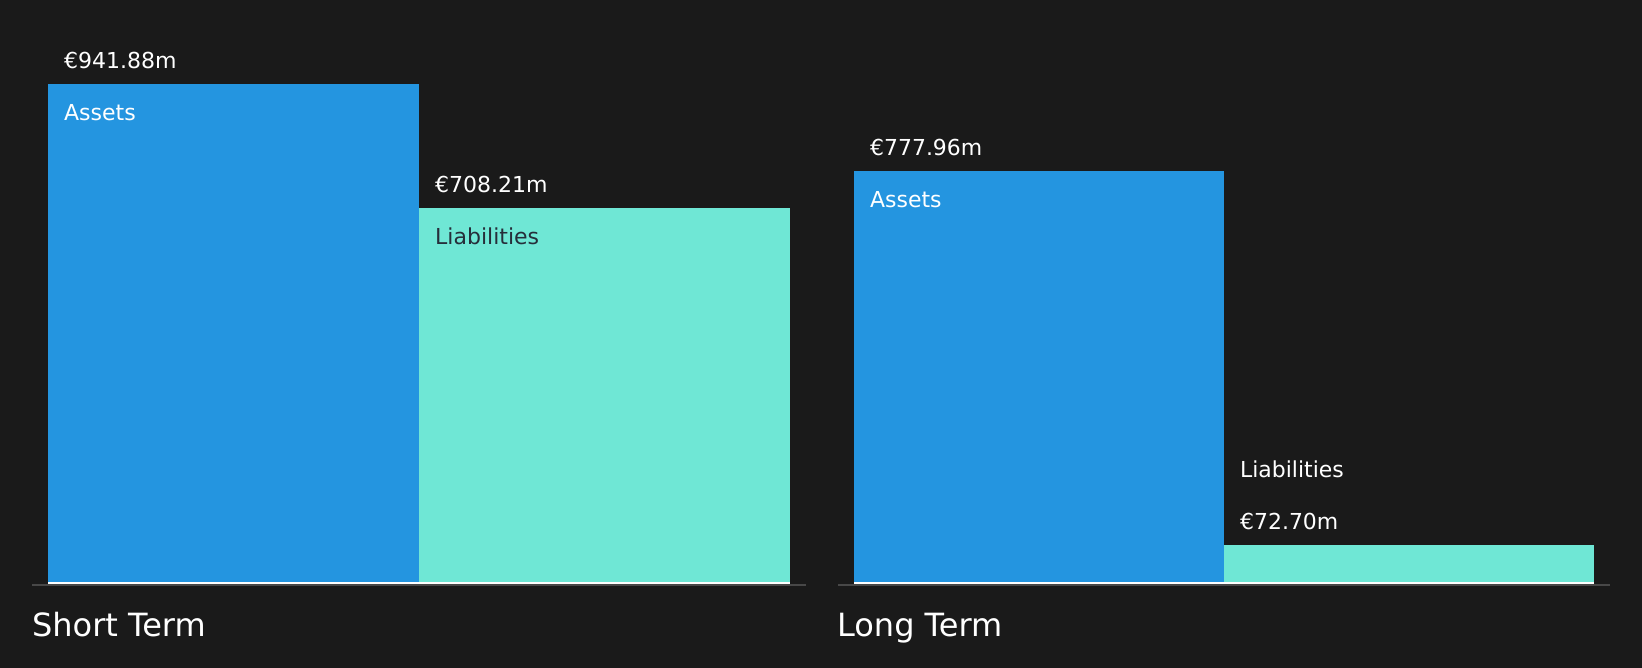
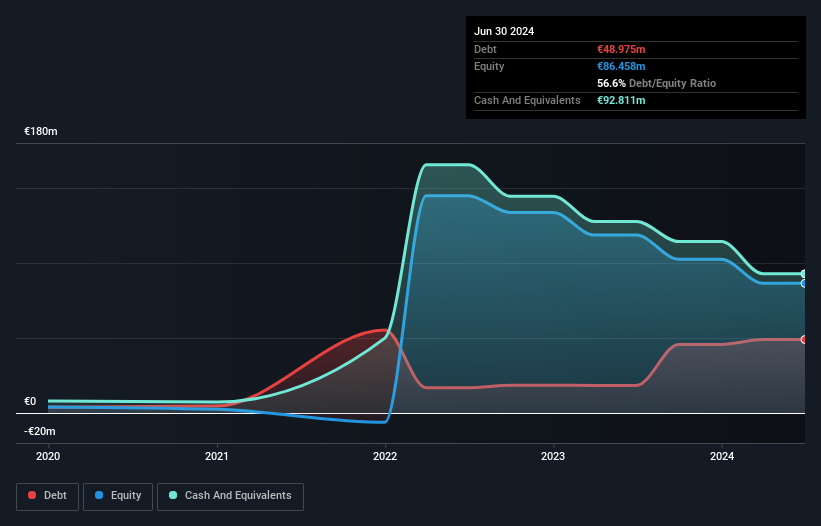
Lhyfe SA, with a market cap of €102.88 million, is navigating the volatile penny stock landscape by focusing on renewable green hydrogen production. Despite being unprofitable and facing increased losses over the past five years, Lhyfe's strategic partnership with Messer could enhance its financial resilience through long-term contracts and equity stakes in key sites. While short-term assets exceed liabilities, long-term liabilities remain uncovered. The company's cash runway appears sufficient for nearly two years under current conditions, though debt levels have escalated significantly over time. Revenue growth is forecasted at 52.69% annually, yet profitability remains elusive in the near term.
- Take a closer look at Lhyfe's potential here in our financial health report.
- Understand Lhyfe's earnings outlook by examining our growth report.
OssDsign (OM:OSSD)
Simply Wall St Financial Health Rating: ★★★★★★
Overview: OssDsign AB (publ) is a company that designs, manufactures, and sells implants and material technology for bone regeneration in the United States, with a market cap of SEK486.20 million.
Operations: The company's revenue from Medical Products amounts to SEK172.55 million.
Market Cap: SEK486.2M
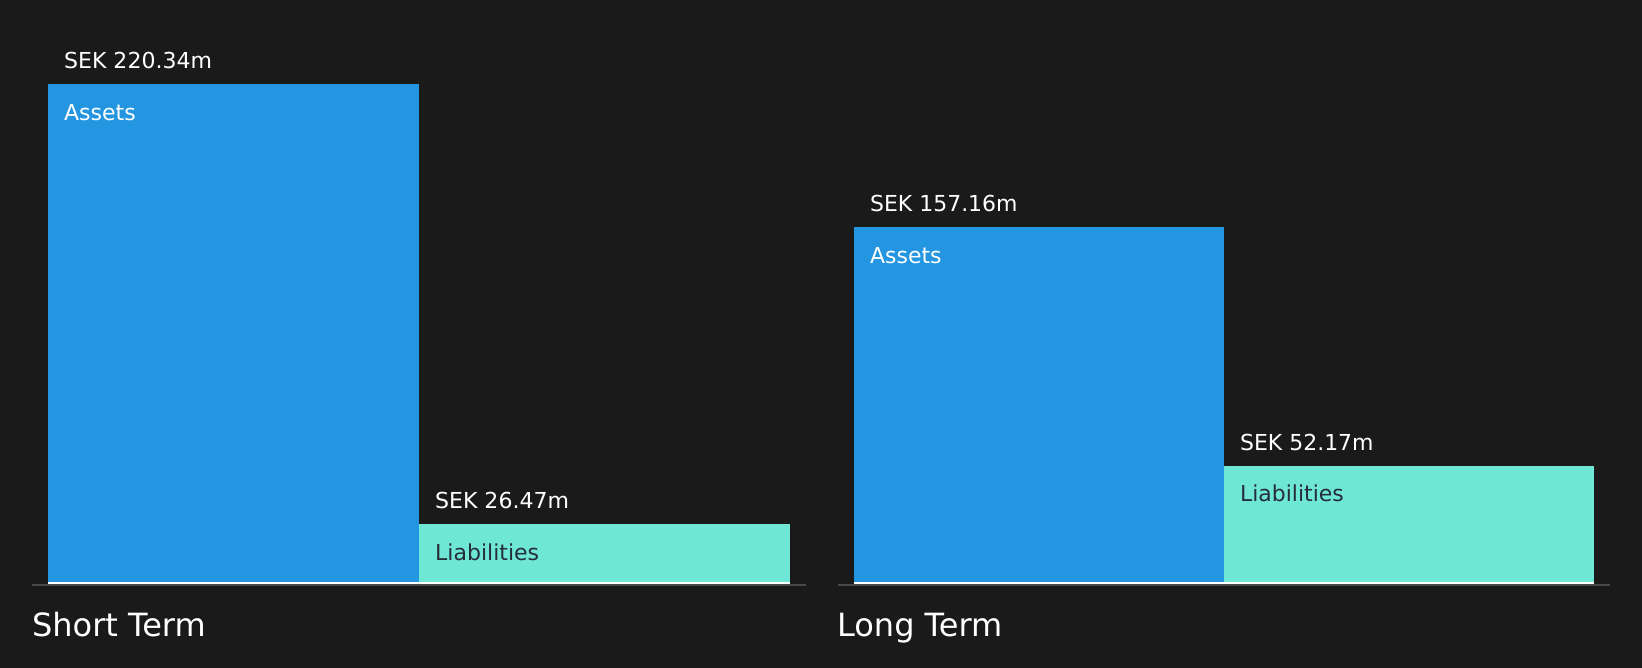
OssDsign AB, with a market cap of SEK486.20 million, operates in the medical equipment sector and faces challenges typical of penny stocks. Despite being unprofitable, it has reduced losses over the past five years by 11.5% annually and forecasts revenue growth at 24.55% per year. The company is debt-free, with short-term assets exceeding both short- and long-term liabilities significantly (SEK220.3M vs SEK26.5M and SEK52.2M respectively). While its share price has been volatile recently, OssDsign maintains a cash runway exceeding three years if free cash flow continues to grow historically at 4.4%.
- Dive into the specifics of OssDsign here with our thorough balance sheet health report.
- Examine OssDsign's earnings growth report to understand how analysts expect it to perform.
Summing It All Up
- Discover the full array of 305 European Penny Stocks right here.
- Seeking Other Investments? AI is about to change healthcare. These 133 stocks are working on everything from early diagnostics to drug discovery. The best part - they are all under $10b in market cap - there's still time to get in early.
This article by Simply Wall St is general in nature. We provide commentary based on historical data and analyst forecasts only using an unbiased methodology and our articles are not intended to be financial advice. It does not constitute a recommendation to buy or sell any stock, and does not take account of your objectives, or your financial situation. We aim to bring you long-term focused analysis driven by fundamental data. Note that our analysis may not factor in the latest price-sensitive company announcements or qualitative material. Simply Wall St has no position in any stocks mentioned.
Have feedback on this article? Concerned about the content? Get in touch with us directly. Alternatively, email editorial-team@simplywallst.com