
Fair Isaac (FICO) Stock Seems Undervalued On Cash Flow And Earnings
Fair Isaac stock has pulled back sharply this year after a strong multi year run, yet both its Discounted Cash Flow (DCF) intrinsic value estimate and earnings based multiples still point to an undervalued setup at the current US$1,110.70 share price.
- Over the past 5 years Fair Isaac has returned 148.4%, which puts the current weakness into the context of a longer period of strong shareholder gains.
- The recent move to list Alogram's explainable fraud intelligence tools on the FICO Marketplace can support growth expectations around the FICO Platform. However, any slowdown in adoption of these AI driven decisioning and fraud offerings may weigh on how much value investors are willing to assign to future cash flows.
- Fair Isaac screens as undervalued on both its intrinsic value estimate and earnings multiples, and its broader checks also lean cheap with a value score of 5 out of 6.
The stock's next move may depend on whether investors see the recent share price decline as bringing Fair Isaac closer to its intrinsic value or still leaving a meaningful margin between price and estimated worth.
Find out why Fair Isaac's -15.7% return over the last year is lagging behind its peers.
Does Fair Isaac Look Undervalued on Cash Flow?
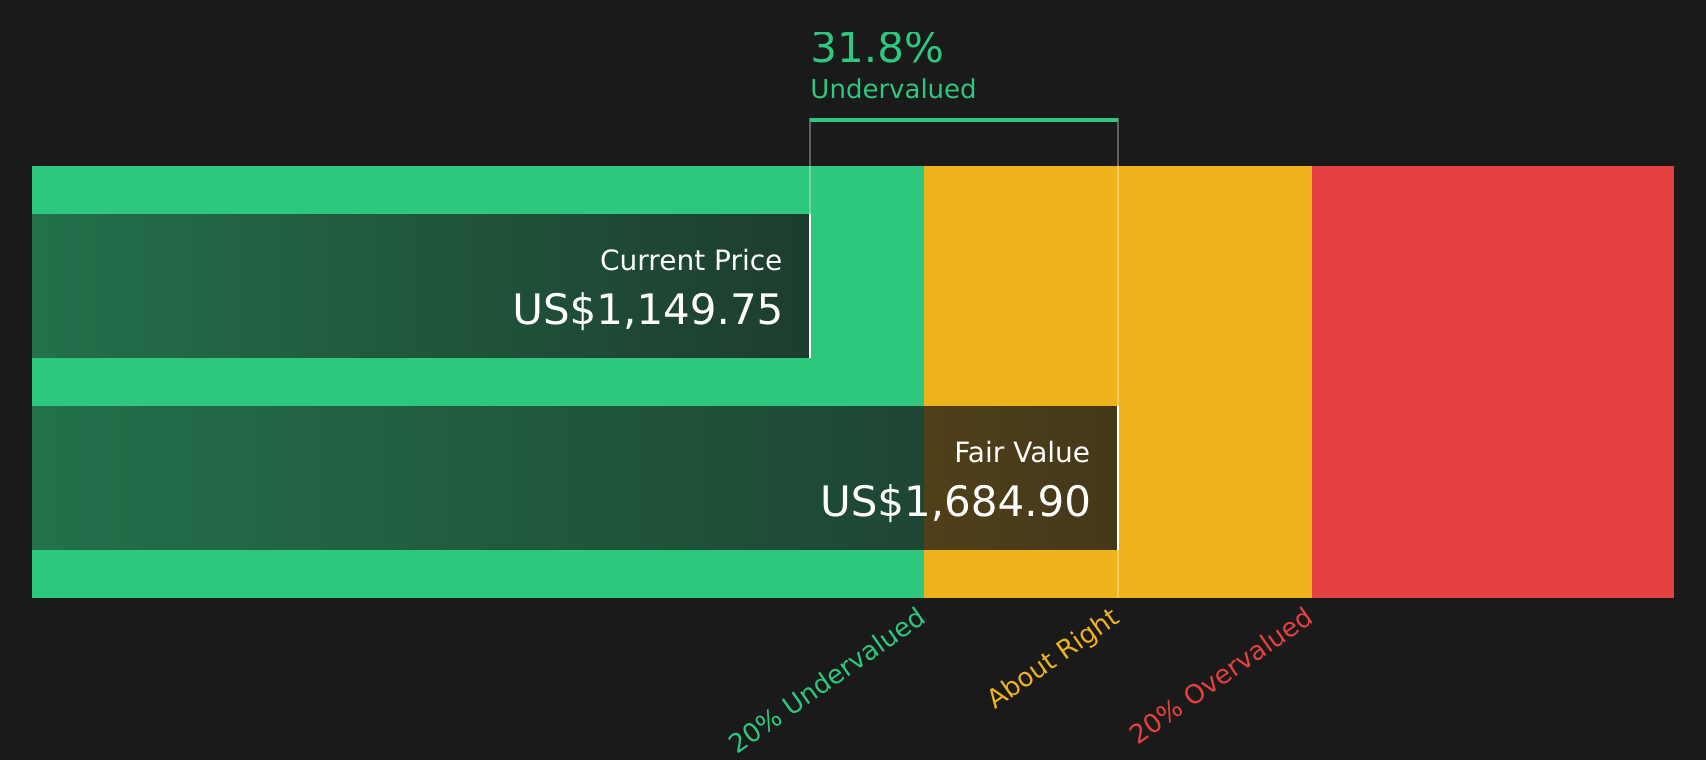
The Discounted Cash Flow (DCF) model estimates the value of Fair Isaac by projecting the cash it could return to shareholders in the future and discounting that back to today. For Fair Isaac, the model uses last twelve month free cash flow of about $964 million and assumes these cash flows keep growing from current levels rather than shrinking. On that basis, the 2 Stage Free Cash Flow to Equity approach points to an estimated intrinsic value of about $1,660 per share.
Set against the current US$1,110.70 share price, the DCF implies the stock trades at about a 33.1% discount to this intrinsic value. This indicates that, on this measure, Fair Isaac screens as undervalued on cash flow alone. The move to list Alogram's fraud intelligence tools on the FICO Marketplace adds a concrete use case for the platform, yet the market price still sits below the level indicated by this cash flow model.
On this cash flow view, Fair Isaac stock currently appears undervalued relative to its estimated intrinsic worth.
Our Discounted Cash Flow (DCF) analysis suggests Fair Isaac is undervalued by 33.1%. Track this in your watchlist or portfolio, or discover 51 more high quality undervalued stocks.
Is Fair Isaac Still Cheap on Earnings?
P/E is a useful cross check for Fair Isaac because earnings are a key focus for many investors in established software companies. Fair Isaac currently trades on a P/E of about 29.4x, which sits below both the wider Software sector average of 32.8x and the peer group average of 68.1x.
The valuation framework used here suggests a fair P/E ratio of about 34.3x for Fair Isaac, based on its profile relative to other software stocks. That sits above the current 29.4x multiple, which leaves a gap between what this model implies investors might be willing to pay for each dollar of earnings and what the market is currently assigning.
On this earnings multiple, Fair Isaac stock currently trades on a lower multiple than the level suggested by its fair P/E ratio.

See what the numbers say about this price — find out in our valuation breakdown.
The Fair Isaac Narrative: What Would Justify Today's Price?
Simply Wall St Narratives pick up where the Fair Isaac valuation puzzle leaves off. They spell out what mix of future growth, margins and earnings would need to hold for the stock to be worth materially more or less than today’s price on the community page. Rather than relying on a single multiple or model result, each scenario lays out the key drivers behind its fair value so you can compare those assumptions with Fair Isaac's reported numbers over time.
One of the top community narratives on Fair Isaac: 27% undervalued
"The ongoing transition to SaaS and cloud-based delivery, evidenced by double-digit growth in FICO Platform ARR and emphasis on conversion to next-generation AI-driven decisioning solutions, is increasing recurring revenues…"
Read one of the top narratives on Fair Isaac
Do you think there's more to the story for Fair Isaac? Head over to our Community to see what others are saying!
The Bottom Line
Fair Isaac screens as undervalued on both the Discounted Cash Flow (DCF) intrinsic value estimate and its current P/E multiple relative to sector and peer benchmarks. The broader checks also lean supportive, which puts the focus on whether the cash flows and earnings profile that underpin those models stay intact.
From here, the key question is whether demand holds up for Fair Isaac's AI driven decisioning and fraud products such as the Alogram partnership on the FICO Marketplace. The answer to that will likely decide whether the current discount reflects an opportunity or a fair response to execution risk.
This article by Simply Wall St is general in nature. We provide commentary based on historical data and analyst forecasts only using an unbiased methodology and our articles are not intended to be financial advice. It does not constitute a recommendation to buy or sell any stock, and does not take account of your objectives, or your financial situation. We aim to bring you long-term focused analysis driven by fundamental data. Note that our analysis may not factor in the latest price-sensitive company announcements or qualitative material. Simply Wall St has no position in any stocks mentioned.
Have feedback on this article? Concerned about the content? Get in touch with us directly. Alternatively, email editorial-team@simplywallst.com