
Does Mixed Q1 Results And Dividend Recalibration Change The Bull Case For Kajima (TSE:1812)?
- Kajima Corporation recently reported first-quarter 2026 results showing lower sales and revenue year-on-year but higher net income and earnings per share, while also issuing full-year 2027 earnings guidance and adjusting its dividend outlook.
- The company’s plan to raise the interim dividend to ¥73.00 per share yet lower the full-year payout versus last year highlights a recalibration of shareholder returns amid shifting profit and cash flow priorities.
- Against this backdrop, we’ll explore how Kajima’s stronger earnings, revised full-year dividend, and updated profit guidance influence its broader investment narrative.
AI is about to change healthcare. These 6 stocks are working on everything from early diagnostics to drug discovery. The best part - they are all under $10b in market cap - there's still time to get in early.
What Is Kajima's Investment Narrative?
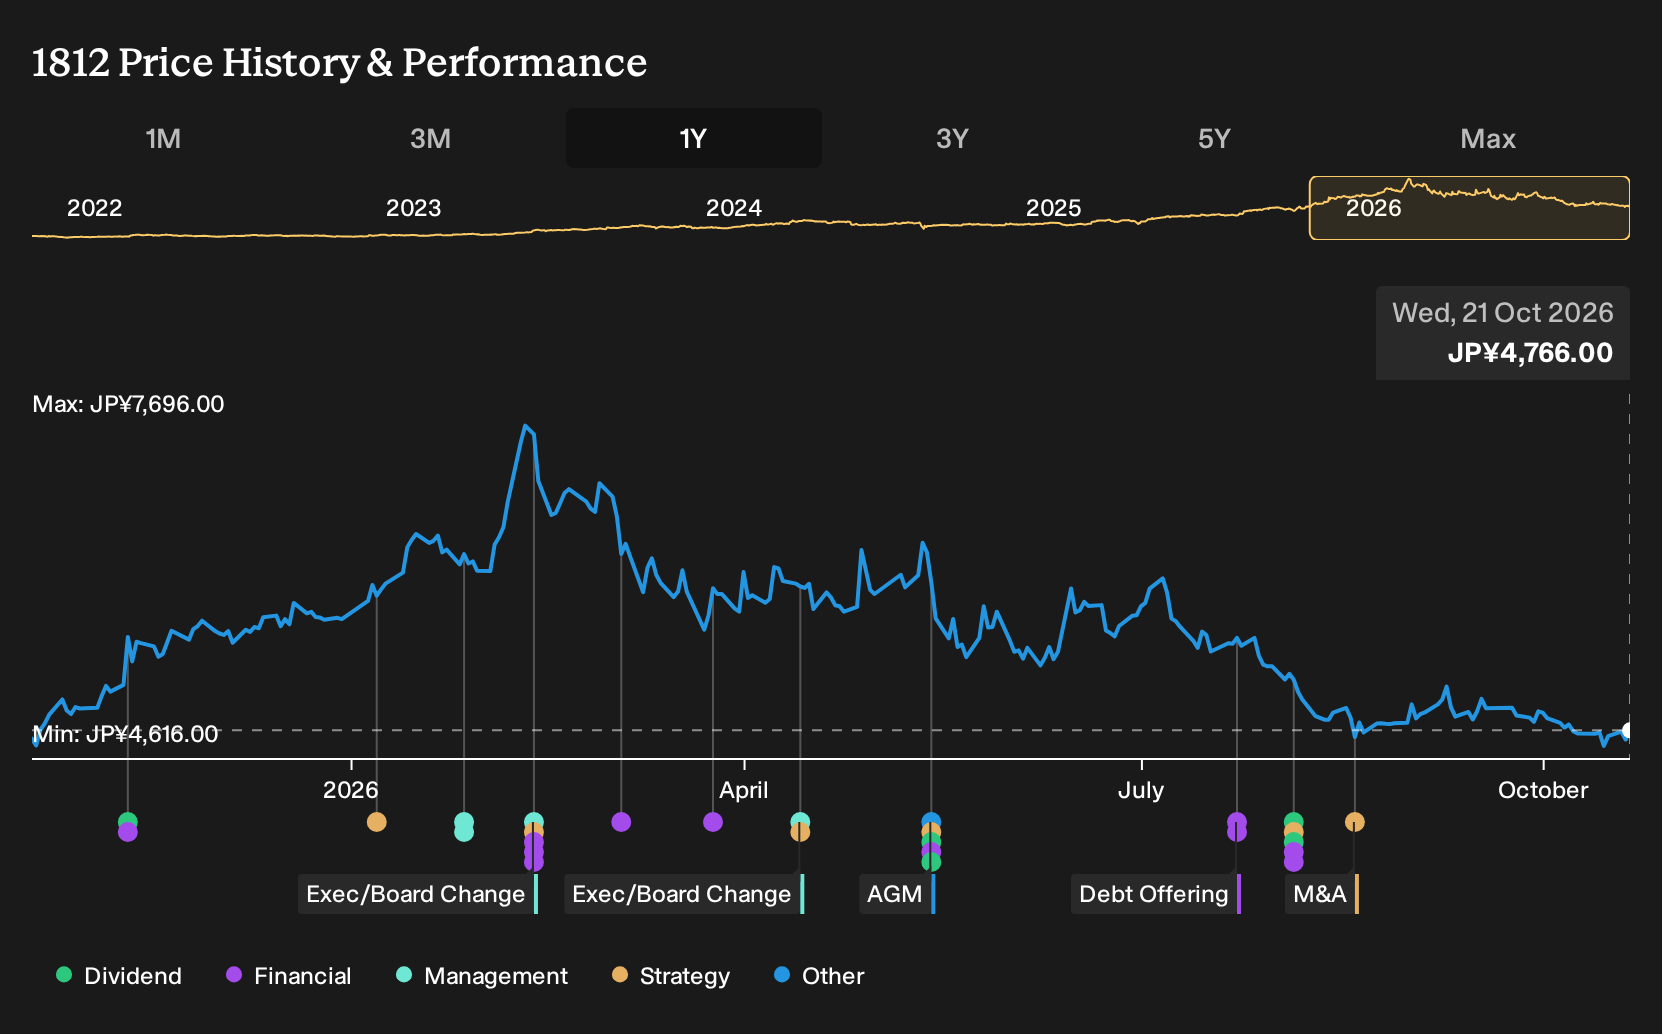
For someone looking at Kajima today, the core belief is that a mature, large-scale contractor can still create value through disciplined profitability and measured capital returns, even if headline growth is modest and the share price has lagged the broader market recently. The latest quarter fits that story: sales and revenue softened, but net income and EPS improved, suggesting project mix and execution mattered more than top line. At the same time, guidance for fiscal 2027 points to steady earnings while the dividend reset, with a higher interim payout but lower full-year level versus last year, hints at tighter cash flow management and possibly lumpier project timing. Combined with ongoing buybacks and governance changes after the CEO transition, these moves subtly shift short term catalysts toward margins, order quality, and capital allocation, while keeping risks around slower growth and execution firmly in focus.
However, the recalibrated dividend policy is a new signal investors should understand closely. Despite retreating, Kajima's shares might still be trading above their fair value and there could be some more downside. Discover how much.Exploring Other Perspectives
Explore 2 other fair value estimates on Kajima - why the stock might be worth just ¥7321!
Reach Your Own Conclusion
Don't just follow the ticker - dig into the data and build a conviction that's truly your own.
- A great starting point for your Kajima research is our analysis highlighting 4 key rewards and 1 important warning sign that could impact your investment decision.
- Our free Kajima research report provides a comprehensive fundamental analysis summarized in a single visual - the Snowflake - making it easy to evaluate Kajima's overall financial health at a glance.
Curious About Other Options?
Early movers are already taking notice. See the stocks they're targeting before they've flown the coop:
- Capitalize on the AI infrastructure supercycle with our selection of the 55 best 'picks and shovels' of the AI gold rush converting record-breaking demand into massive cash flow.
- Rare earth metals are an input to most high-tech devices, military and defence systems and electric vehicles. The global race is on to secure supply of these critical minerals. Beat the pack to uncover the 28 best rare earth metal stocks of the very few that mine this essential strategic resource.
- We've uncovered the 33 dividend fortresses yielding 5%+ that don't just survive market storms, but thrive in them.
This article by Simply Wall St is general in nature. We provide commentary based on historical data and analyst forecasts only using an unbiased methodology and our articles are not intended to be financial advice. It does not constitute a recommendation to buy or sell any stock, and does not take account of your objectives, or your financial situation. We aim to bring you long-term focused analysis driven by fundamental data. Note that our analysis may not factor in the latest price-sensitive company announcements or qualitative material. Simply Wall St has no position in any stocks mentioned.
Have feedback on this article? Concerned about the content? Get in touch with us directly. Alternatively, email editorial-team@simplywallst.com