
Subaru (TSE:7270) Looks Pricey On North America Financing Move And Q1 Results
Subaru (TSE:7270) is drawing fresh attention after outlining plans to enter the North American automotive financing market, alongside releasing its Q1 2027 results. Together, these updates give investors new information on growth plans and recent performance.
See our latest analysis for Subaru.
Despite the recent Q1 2027 update and the plan to launch North American automotive financing, Subaru’s share price return is down 25.02% year to date, while the 5 year total shareholder return of 55.04% points to much stronger longer term gains.
If this kind of long term story appeals to you, it could be a suitable moment to widen your watchlist with 11 top founder-led companies
This mix of a weaker year to date share price and Subaru’s move into North American auto financing raises a key issue: Are investors marking down solid underlying plans, or is the stock simply catching up with changing sentiment as the valuation stands today?
Price-to-Earnings of 21.4x: Is it justified?
On current numbers, Subaru trades on a P/E of 21.4x. This sits above several reference points and invites a closer look at what the market is pricing in.
The P/E ratio compares the company’s share price with its earnings per share. For an automaker like Subaru, it gives a quick sense of how much investors are paying for each unit of current earnings.
Subaru’s P/E of 21.4x is described as expensive relative to its estimated fair P/E of 17.9x, the peer average of 17.1x, and the wider Asian auto industry average of 13.7x. This suggests the current market price is assigning a premium over both what the SWS fair ratio model indicates and what investors are paying for similar companies. This premium could be viewed as a level the market may eventually move closer to if expectations change.
Explore the SWS fair ratio for Subaru
Result: Price-to-Earnings of 21.4x (OVERVALUED)
However, Subaru’s move into North American auto financing adds regulatory and credit risk, and any change in sentiment could pressure a P/E that already sits above peers.
Find out about the key risks to this Subaru narrative.
Another view on Subaru using our DCF model
The first check suggested Subaru looks expensive on a P/E of 21.4x. A different lens comes from the SWS DCF model, which estimates future cash flow value at ¥2,341.95 per share versus a current price of ¥2,583. This indicates the stock is trading above that cash flow estimate.
Look into how the SWS DCF model arrives at its fair value.
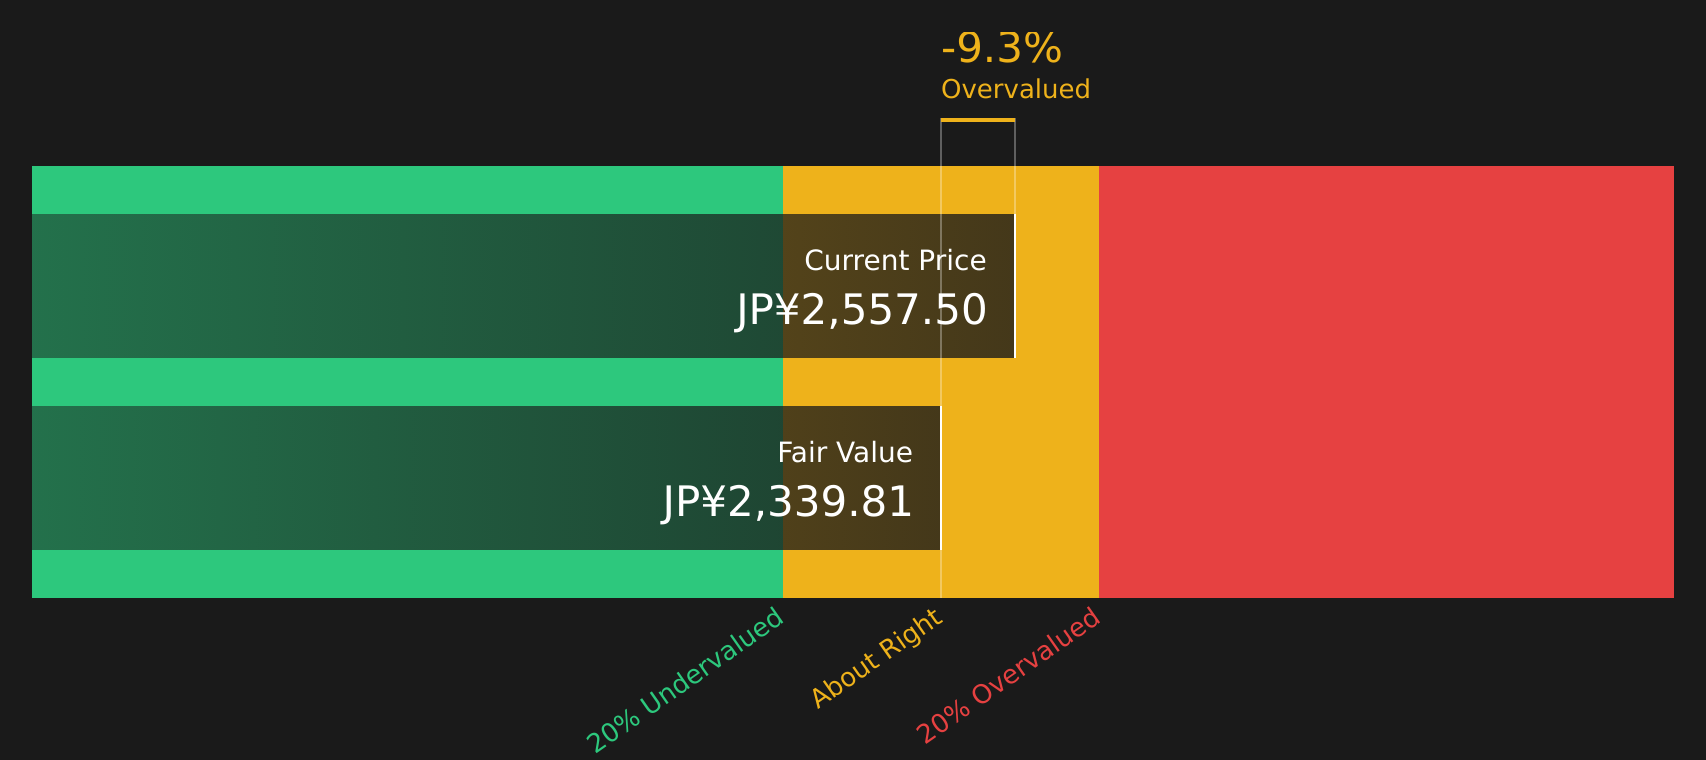
Simply Wall St performs a discounted cash flow (DCF) on every stock in the world every day (check out Subaru for example). We show the entire calculation in full. You can track the result in your watchlist or portfolio and be alerted when this changes, or use our stock screener to discover 25 high quality undervalued stocks. If you save a screener we even alert you when new companies match - so you never miss a potential opportunity.
Next Steps
If this Subaru update leaves you torn between potential upside and the concerns flagged, it makes sense to review the details yourself and decide promptly. A good starting point is to weigh up the 1 key reward and 2 important warning signs.
Looking for more Subaru investment ideas?
If you want to put Subaru in context and avoid missing out on other opportunities, spend a few minutes running fresh ideas through the Simply Wall Street Screener today.
- Spot potential value opportunities early by reviewing companies highlighted in the 25 high quality undervalued stocks and see which ones deserve a closer look next.
- Prioritise resilience by checking out the 60 resilient stocks with low risk scores and focus your attention on stocks with lower overall risk scores.
- Hunt for future standouts by scanning the screener containing 68 high quality undiscovered gems where fewer investors may be paying attention right now.
This article by Simply Wall St is general in nature. We provide commentary based on historical data and analyst forecasts only using an unbiased methodology and our articles are not intended to be financial advice. It does not constitute a recommendation to buy or sell any stock, and does not take account of your objectives, or your financial situation. We aim to bring you long-term focused analysis driven by fundamental data. Note that our analysis may not factor in the latest price-sensitive company announcements or qualitative material. Simply Wall St has no position in any stocks mentioned.
Have feedback on this article? Concerned about the content? Get in touch with us directly. Alternatively, email editorial-team@simplywallst.com