
3 Global Stocks Trading At An Estimated Discount To Enhance Your Portfolio
As global markets navigate mixed signals from easing inflation concerns and geopolitical uncertainties, investors are increasingly seeking opportunities to bolster their portfolios with stocks that may be trading at a discount. In this environment, identifying undervalued stocks can be a strategic move, as these equities often offer potential for growth when market conditions stabilize or improve.
Top 10 Undervalued Stocks Based On Cash Flows
| Name | Current Price | Fair Value (Est) | Discount (Est) |
| ZEAL Network (XTRA:TIMA) | €43.50 | €86.96 | 50% |
| Sahara International Petrochemical (SASE:2310) | SAR13.22 | SAR26.34 | 49.8% |
| New Wave Group (OM:NEWA B) | SEK92.35 | SEK183.13 | 49.6% |
| Murapol (WSE:MUR) | PLN38.80 | PLN77.11 | 49.7% |
| Micro Systemation (OM:MSAB B) | SEK89.40 | SEK177.35 | 49.6% |
| Japan Eyewear Holdings (TSE:5889) | ¥2534.00 | ¥5024.80 | 49.6% |
| ISU Petasys (KOSE:A007660) | ₩95600.00 | ₩190335.35 | 49.8% |
| Generic Sweden (OM:GENI) | SEK40.15 | SEK80.18 | 49.9% |
| Diagnostic Medical Systems (ENXTPA:ALDMS) | €1.07 | €2.13 | 49.8% |
| cBrain (CPSE:CBRAIN) | DKK52.80 | DKK104.54 | 49.5% |
Let's dive into some prime choices out of the screener.
Gjensidige Forsikring (OB:GJF)
Overview: Gjensidige Forsikring ASA, along with its subsidiaries, offers general insurance and pension products across Norway, Sweden, Denmark, Finland, Latvia, Lithuania, and Estonia with a market cap of NOK141.89 billion.
Operations: The company's revenue segments include NOK0.95 billion from Pension, NOK2.24 billion from General Insurance in Sweden, NOK18.85 billion from General Insurance Private, and NOK23.23 billion from General Insurance Commercial.
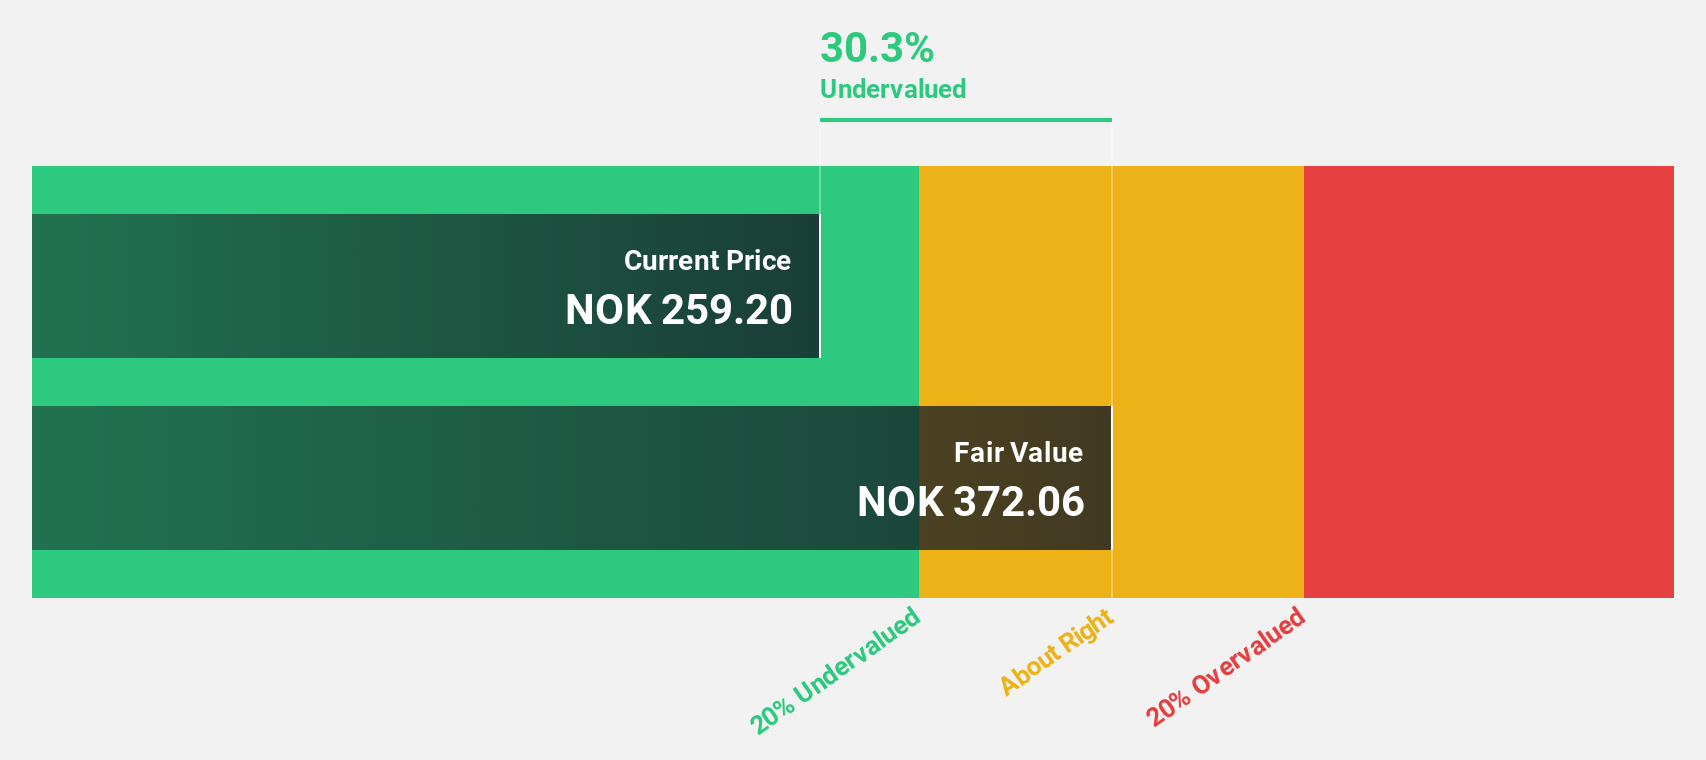
Estimated Discount To Fair Value: 38.1%
Gjensidige Forsikring is trading at NOK 283.8, significantly below its estimated future cash flow value of NOK 458.71, suggesting it may be undervalued based on cash flows. Despite a modest revenue growth forecast of 3.6% annually, its earnings are expected to grow faster than the Norwegian market at 12.2% per year. However, recent earnings show a slight decline in net income and EPS compared to the previous year, and its dividend coverage by free cash flows is weak.
- Our expertly prepared growth report on Gjensidige Forsikring implies its future financial outlook may be stronger than recent results.
- Dive into the specifics of Gjensidige Forsikring here with our thorough financial health report.
freee K.K (TSE:4478)
Overview: freee K.K. provides cloud-based accounting and HR software solutions in Japan, with a market cap of ¥198.63 billion.
Operations: The company generates revenue from its Platform Business segment, which amounted to ¥42.44 billion.
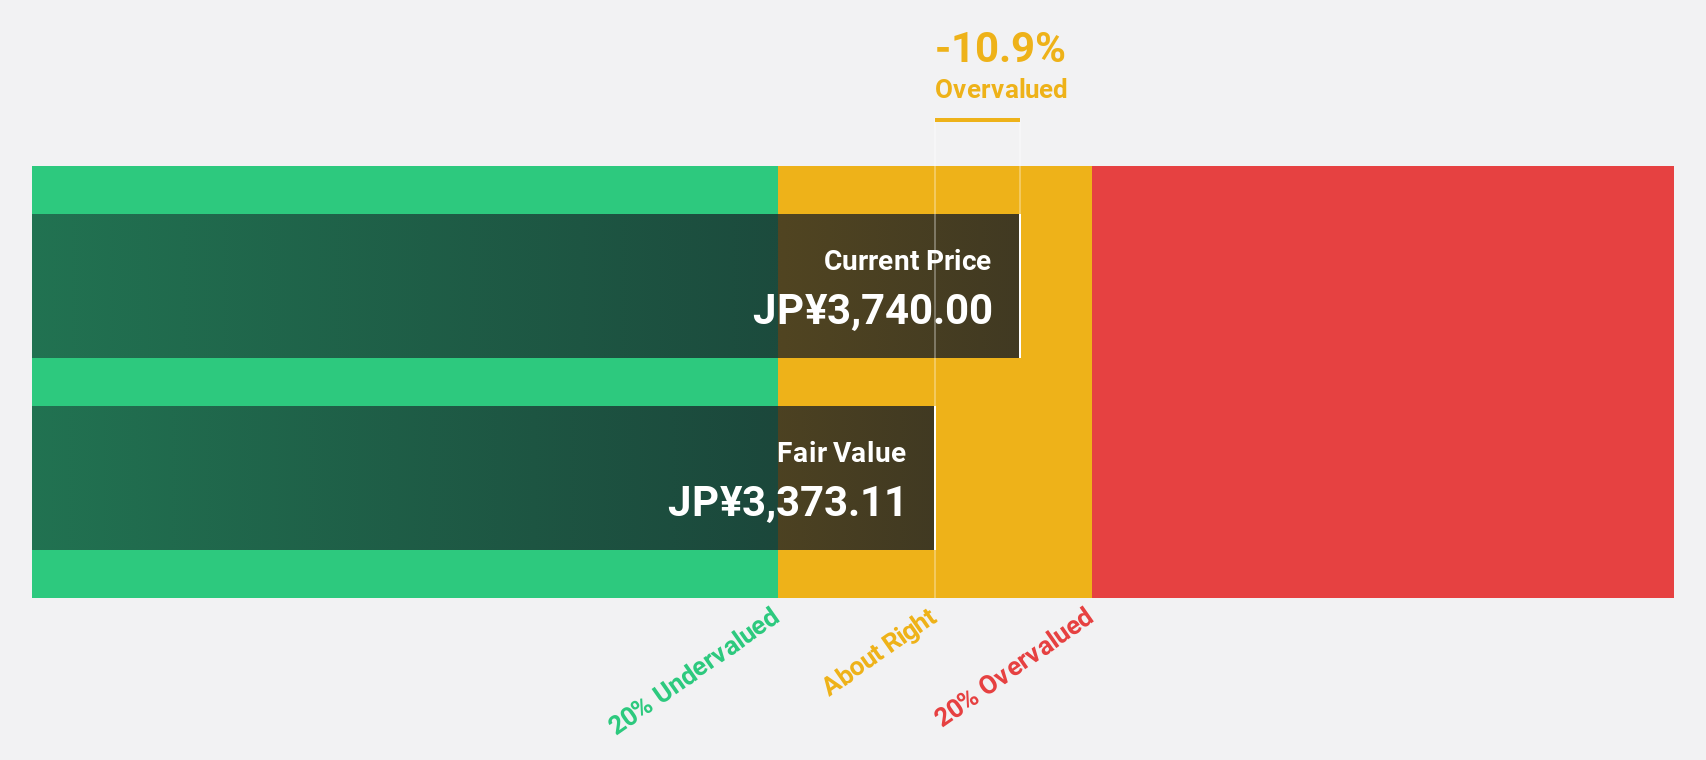
Estimated Discount To Fair Value: 45.1%
freee K.K. is trading at ¥3,375, considerably below its future cash flow value estimate of ¥6,151.9, indicating potential undervaluation based on cash flows. Despite a forecasted revenue growth of 16.1% annually—surpassing the Japanese market average—profit margins have declined from 4.1% to 2.5%. Earnings are expected to grow significantly at 43.85% per year, although recent results show a decrease in net income and EPS compared to last year.
- The analysis detailed in our freee K.K growth report hints at robust future financial performance.
- Delve into the full analysis health report here for a deeper understanding of freee K.K.
Meiko Electronics (TSE:6787)
Overview: Meiko Electronics Co., Ltd. designs, manufactures, and sells printed circuit boards and auxiliary electronics across Japan, China, Vietnam, other parts of Asia, North America, Europe, and globally with a market cap of ¥468.42 billion.
Operations: The company generates revenue from its operations in the design, manufacture, and sale of printed circuit boards and auxiliary electronics across various regions including Japan, China, Vietnam, other parts of Asia, North America, Europe, and globally.
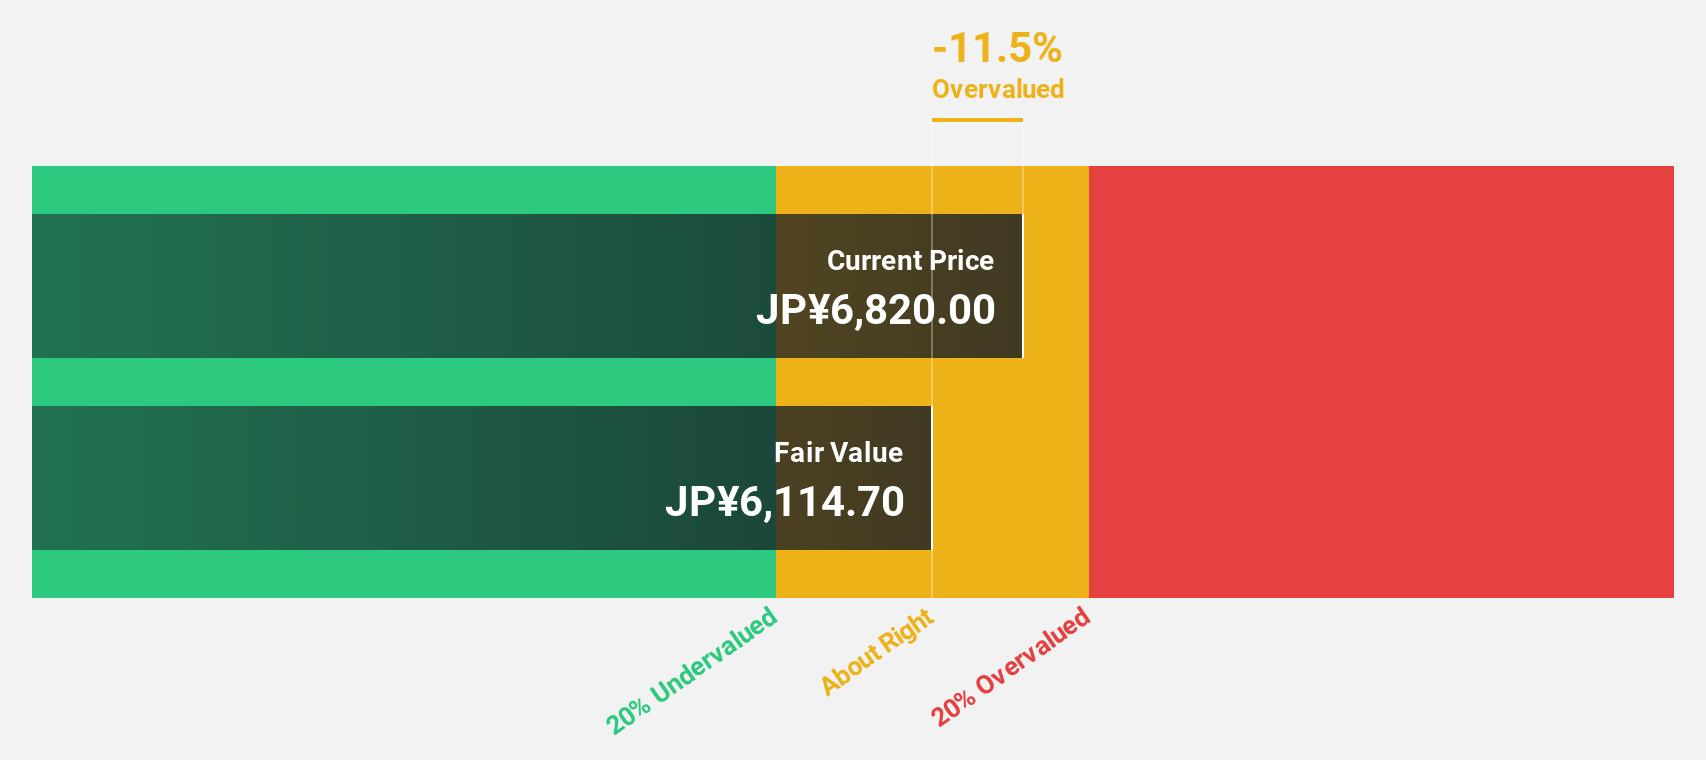
Estimated Discount To Fair Value: 35.5%
Meiko Electronics is trading at ¥19,460, below its estimated future cash flow value of ¥30,183.92. With projected annual earnings growth of 30.1% and revenue anticipated to rise by 20.9%, the company shows strong potential compared to the Japanese market averages. However, its debt coverage through operating cash flow remains a concern amidst high share price volatility over recent months. The company's restructuring in China may impact future performance positively or negatively depending on execution.
- The growth report we've compiled suggests that Meiko Electronics' future prospects could be on the up.
- Click here to discover the nuances of Meiko Electronics with our detailed financial health report.
Next Steps
- Reveal the 452 hidden gems among our Undervalued Global Stocks Based On Cash Flows screener with a single click here.
- Got skin in the game with these stocks? Elevate how you manage them by using Simply Wall St's portfolio, where intuitive tools await to help optimize your investment outcomes.
- Simply Wall St is your key to unlocking global market trends, a free user-friendly app for forward-thinking investors.
Contemplating Other Strategies?
- Explore high-performing small cap companies that haven't yet garnered significant analyst attention.
- Diversify your portfolio with solid dividend payers offering reliable income streams to weather potential market turbulence.
- Fuel your portfolio with companies showing strong growth potential, backed by optimistic outlooks both from analysts and management.
This article by Simply Wall St is general in nature. We provide commentary based on historical data and analyst forecasts only using an unbiased methodology and our articles are not intended to be financial advice. It does not constitute a recommendation to buy or sell any stock, and does not take account of your objectives, or your financial situation. We aim to bring you long-term focused analysis driven by fundamental data. Note that our analysis may not factor in the latest price-sensitive company announcements or qualitative material. Simply Wall St has no position in any stocks mentioned.
Have feedback on this article? Concerned about the content? Get in touch with us directly. Alternatively, email editorial-team@simplywallst.com