
How Investors Are Reacting To Kikkoman (TSE:2801) Issuing Detailed FY2027 Earnings and EPS Guidance
- Earlier this month, Kikkoman Corporation issued consolidated earnings guidance for the fiscal year ending March 31, 2027, projecting revenue of ¥799,100 million, business profit of ¥82,300 million, operating profit of ¥78,800 million, profit attributable to owners of the parent of ¥61,300 million, and basic earnings per share of ¥66.16.
- This detailed outlook gives investors a clearer view of how Kikkoman expects its core operations to translate into profitability and earnings per share over the current fiscal year.
- With Kikkoman now outlining expected profit attributable to owners of the parent, we’ll explore how this guidance shapes the company’s investment narrative.
We've uncovered the 32 dividend fortresses yielding 5%+ that don't just survive market storms, but thrive in them.
What Is Kikkoman's Investment Narrative?
To own Kikkoman, you really have to believe in the resilience of its global seasoning brands and the company’s ability to steadily convert that into earnings, even as growth expectations remain modest and the shares trade at a premium P/E to both peers and the broader food sector. The new FY2027 guidance, with detailed profit and EPS targets, largely reinforces the existing narrative rather than changing it, so it may not move the needle on near term catalysts like sentiment around valuation, dividend consistency, or the underused buyback authorization. At the same time, it gives investors a firmer reference point to judge whether current pricing already reflects Kikkoman’s slower forecast growth and relatively low return on equity, which remain key risks to watch.
However, one risk investors should be aware of is how Kikkoman’s premium valuation could compress if growth disappoints. Kikkoman's shares have been on the rise but are still potentially undervalued by 6%. Find out what it's worth.Exploring Other Perspectives
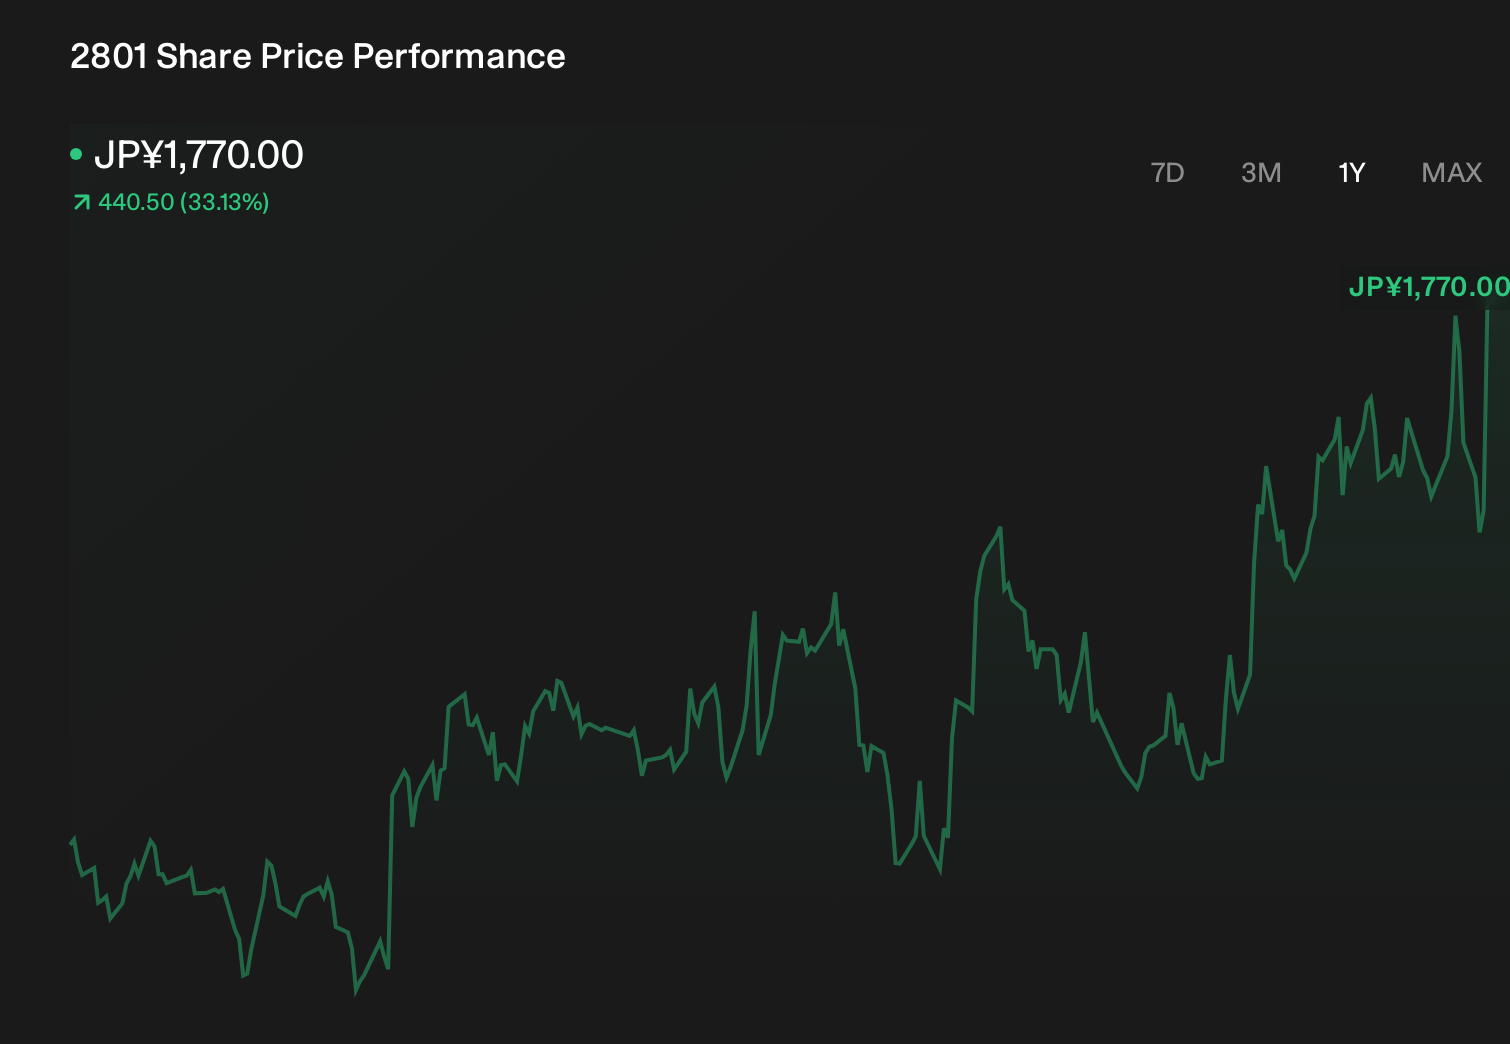
Explore another fair value estimate on Kikkoman - why the stock might be worth as much as 6% more than the current price!
The Verdict Is Yours
Don't just follow the ticker - dig into the data and build a conviction that's truly your own.
- A great starting point for your Kikkoman research is our analysis highlighting 3 key rewards that could impact your investment decision.
- Our free Kikkoman research report provides a comprehensive fundamental analysis summarized in a single visual - the Snowflake - making it easy to evaluate Kikkoman's overall financial health at a glance.
Curious About Other Options?
Early movers are already taking notice. See the stocks they're targeting before they've flown the coop:
- The future of work is here. Discover the 37 top robotics and automation stocks leading the charge in AI-driven automation and industrial transformation.
- Capitalize on the AI infrastructure supercycle with our selection of the 56 best 'picks and shovels' of the AI gold rush converting record-breaking demand into massive cash flow.
- This technology could replace computers: discover 24 stocks that are working to make quantum computing a reality.
This article by Simply Wall St is general in nature. We provide commentary based on historical data and analyst forecasts only using an unbiased methodology and our articles are not intended to be financial advice. It does not constitute a recommendation to buy or sell any stock, and does not take account of your objectives, or your financial situation. We aim to bring you long-term focused analysis driven by fundamental data. Note that our analysis may not factor in the latest price-sensitive company announcements or qualitative material. Simply Wall St has no position in any stocks mentioned.
Have feedback on this article? Concerned about the content? Get in touch with us directly. Alternatively, email editorial-team@simplywallst.com