
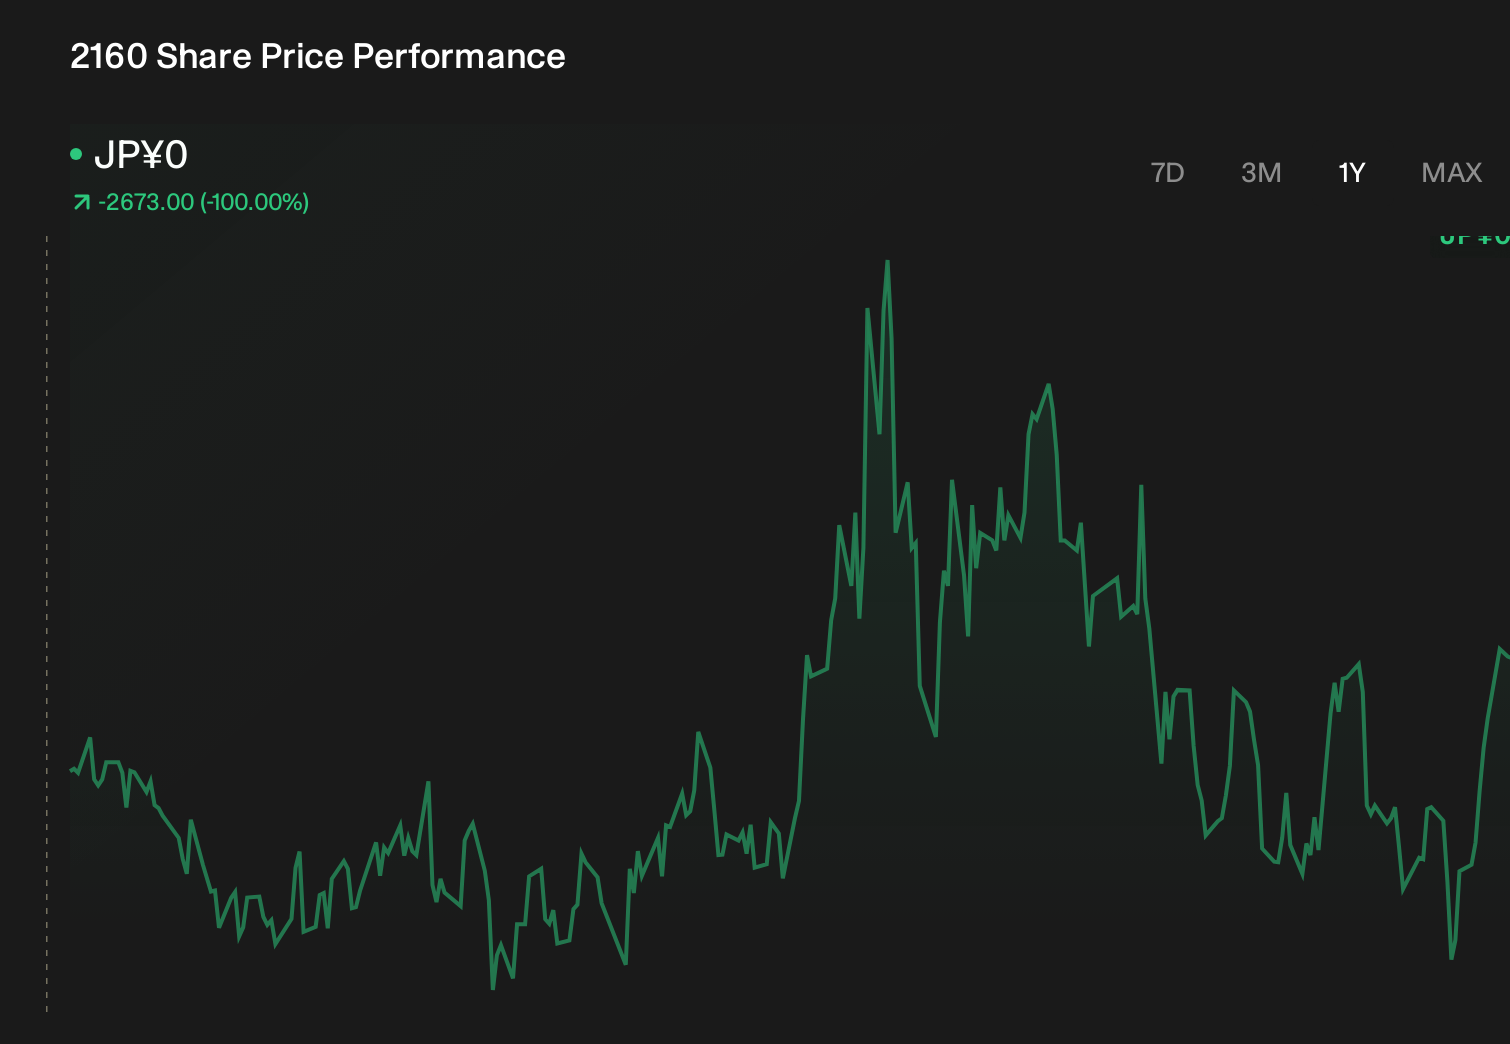
GNI Group (TSE:2160) Is Down 8.4% After Half-Year Loss Widens And EPS Deficit Deepens – Has The Bull Case Changed?
- GNI Group Ltd. reported past half-year results for the period ended June 30, 2026, with sales of ¥11,937 million versus ¥12,252 million a year earlier and a wider net loss of ¥1,988 million.
- The doubling of basic and diluted loss per share from continuing operations to ¥35.66 highlights mounting pressure on the company’s profitability profile.
- We’ll now examine how this widening net loss and sharper per-share deficit may influence GNI Group’s broader investment narrative.
Rare earth metals are an input to most high-tech devices, military and defence systems and electric vehicles. The global race is on to secure supply of these critical minerals. Beat the pack to uncover the 28 best rare earth metal stocks of the very few that mine this essential strategic resource.
What Is GNI Group's Investment Narrative?
For someone considering GNI Group today, the core belief still has to be that its portfolio of China-focused specialty drugs and pipeline assets can eventually justify the current volatility and sustained losses. The latest half-year numbers, with sales slightly lower and the net loss almost doubling, put more weight on near-term execution risks and on management’s 2026 revenue guidance of ¥27,158 million. In the short term, the key catalyst remains clinical and regulatory progress at subsidiaries like Gyre, but the widening loss and higher per-share deficit make the timing and cost of getting there more important than before. The recent result also keeps capital-raising and further dilution on the table, especially after the 2025 equity offering, which may temper how confidently investors lean into the longer-term story.
However, one funding-related risk around future shareholder dilution is worth paying close attention to. Despite retreating, GNI Group's shares might still be trading above their fair value and there could be some more downside. Discover how much.Exploring Other Perspectives
Explore another fair value estimate on GNI Group - why the stock might be worth just ¥4400!
Reach Your Own Conclusion
Disagree with this assessment? Extraordinary investment returns rarely come from following the herd, so go with your instincts.
- A great starting point for your GNI Group research is our analysis highlighting 2 key rewards and 2 important warning signs that could impact your investment decision.
- Our free GNI Group research report provides a comprehensive fundamental analysis summarized in a single visual - the Snowflake - making it easy to evaluate GNI Group's overall financial health at a glance.
Want Some Alternatives?
Right now could be the best entry point. These picks are fresh from our daily scans. Don't delay:
- Capitalize on the AI infrastructure supercycle with our selection of the 56 best 'picks and shovels' of the AI gold rush converting record-breaking demand into massive cash flow.
- Invest in the nuclear renaissance through our list of 92 elite nuclear energy infrastructure plays powering the global AI revolution.
- Find 24 companies with promising cash flow potential yet trading below their fair value.
This article by Simply Wall St is general in nature. We provide commentary based on historical data and analyst forecasts only using an unbiased methodology and our articles are not intended to be financial advice. It does not constitute a recommendation to buy or sell any stock, and does not take account of your objectives, or your financial situation. We aim to bring you long-term focused analysis driven by fundamental data. Note that our analysis may not factor in the latest price-sensitive company announcements or qualitative material. Simply Wall St has no position in any stocks mentioned.
Have feedback on this article? Concerned about the content? Get in touch with us directly. Alternatively, email editorial-team@simplywallst.com