
3 Value Stock Picks That May Be Trading At A Discount
The United States market has remained flat over the last week but is up 20% over the past year, with earnings forecasted to grow by 17% annually. In such a climate, identifying undervalued stocks that may be trading at a discount can present opportunities for investors seeking to capitalize on potential growth while maintaining value.
Top 10 Undervalued Stocks Based On Cash Flows In The United States
| Name | Current Price | Fair Value (Est) | Discount (Est) |
| Sprout Social (SPT) | $9.89 | $19.10 | 48.2% |
| Southwest Airlines (LUV) | $44.26 | $84.49 | 47.6% |
| Reddit (RDDT) | $178.09 | $349.79 | 49.1% |
| OceanFirst Financial (OCFC) | $19.77 | $38.31 | 48.4% |
| Natera (NTRA) | $309.93 | $607.24 | 49% |
| Lumentum Holdings (LITE) | $926.14 | $1851.28 | 50% |
| HBT Financial (HBT) | $37.19 | $73.33 | 49.3% |
| Haemonetics (HAE) | $90.80 | $177.22 | 48.8% |
| Fluence Energy (FLNC) | $13.14 | $25.76 | 49% |
| Advanced Energy Industries (AEIS) | $330.26 | $654.65 | 49.6% |
Below we spotlight a couple of our favorites from our exclusive screener.
SOLV Energy (MWH)
Overview: SOLV Energy, Inc. offers infrastructure services to the power industry in the United States and has a market cap of $6.48 billion.
Operations: SOLV Energy, Inc. generates revenue through its infrastructure services tailored for the U.S. power sector.
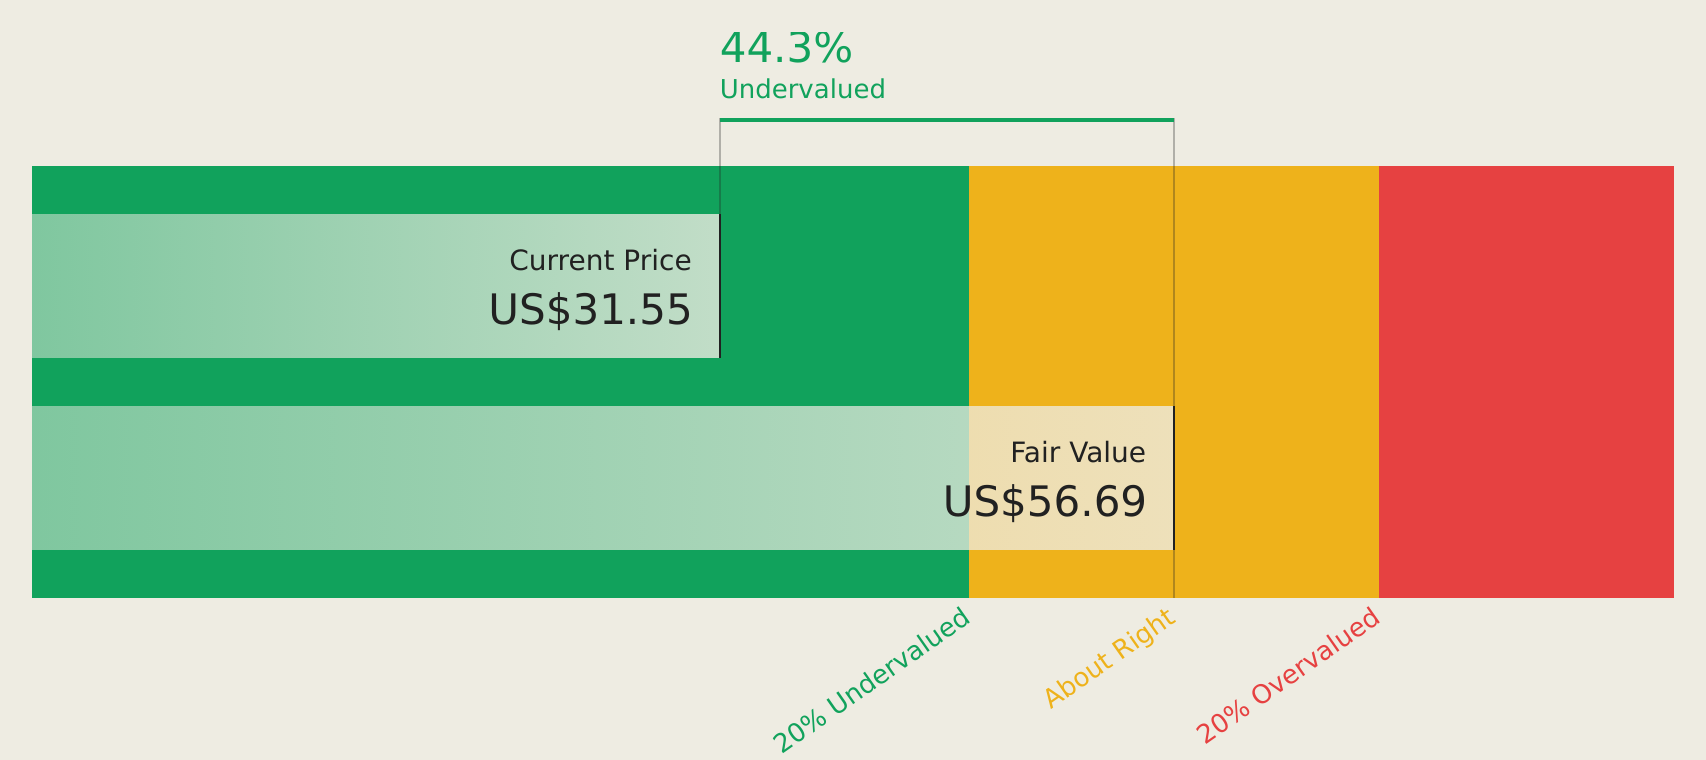
Estimated Discount To Fair Value: 43.6%
SOLV Energy, Inc. appears undervalued based on cash flows, trading 43.6% below its estimated fair value of US$56.69 per share. Despite slower forecasted revenue growth compared to the US market, its earnings are expected to grow significantly at 21.4% annually over the next three years, outpacing market averages. Recent corporate guidance raised revenue expectations for 2026 to between US$3.87 billion and US$3.97 billion, reflecting strong operational performance and potential for future cash flow generation.
- According our earnings growth report, there's an indication that SOLV Energy might be ready to expand.
- Take a closer look at SOLV Energy's balance sheet health here in our report.
CBRE Group (CBRE)
Overview: CBRE Group, Inc. is a commercial real estate services and investment company operating in the United States, the United Kingdom, and internationally, with a market cap of approximately $44.26 billion.
Operations: The company's revenue is primarily derived from Building Operations & Experience ($25.18 billion), Advisory Services ($9.55 billion), Project Management ($8.23 billion), and Real Estate Investments ($823 million).
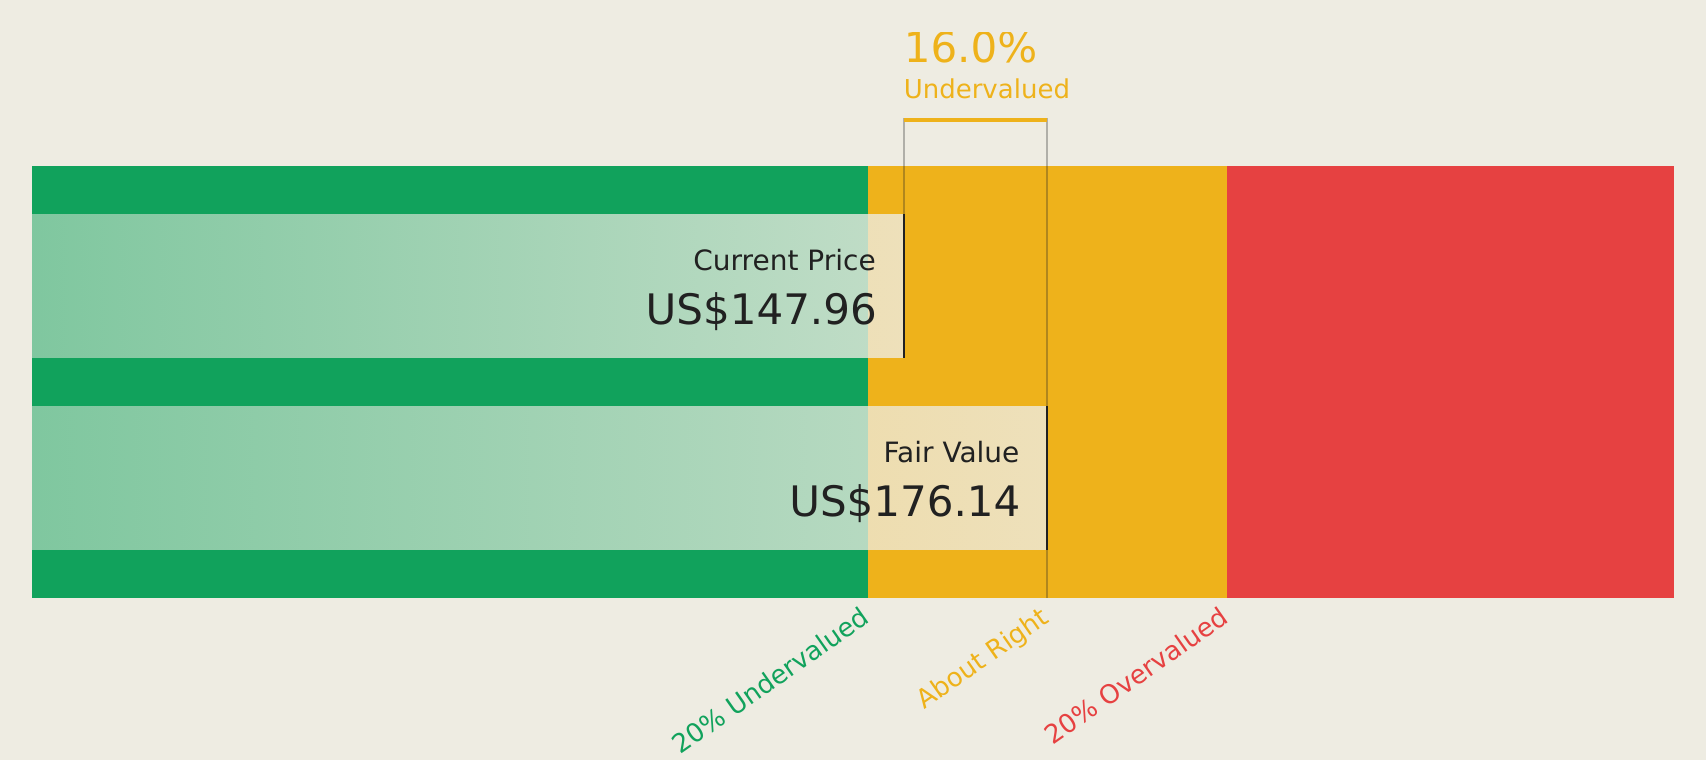
Estimated Discount To Fair Value: 13.2%
CBRE Group is trading at US$152.86, below its estimated future cash flow value of US$176.13, suggesting potential undervaluation based on cash flows. Despite a slower revenue growth forecast of 9.2% annually compared to the US market, earnings are expected to grow significantly at 20.24% per year, surpassing market averages. Recent earnings showed a rise in six-month net income to US$522 million from last year's US$378 million, reinforcing strong financial performance amidst strategic share repurchases and leadership changes.
- Our comprehensive growth report raises the possibility that CBRE Group is poised for substantial financial growth.
- Click to explore a detailed breakdown of our findings in CBRE Group's balance sheet health report.
Dycom Industries (DY)
Overview: Dycom Industries, Inc. offers specialty contracting services to the digital infrastructure, telecommunications infrastructure, and utility sectors in the United States with a market cap of $12.59 billion.
Operations: The company generates revenue primarily from its Communications segment, which accounts for $5.76 billion.
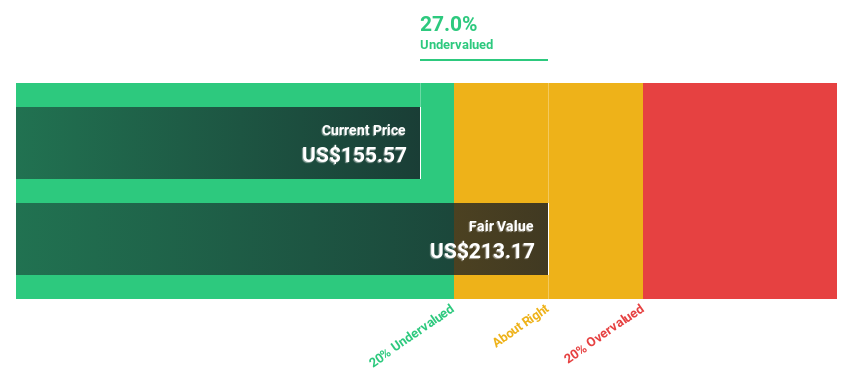
Estimated Discount To Fair Value: 14.0%
Dycom Industries, trading at US$419.07, is below its estimated future cash flow value of US$487.05, indicating potential undervaluation based on cash flows. The company forecasts robust earnings growth of 24.1% annually, outpacing the broader U.S. market average of 17.1%. Recent board appointments enhance strategic financial management capabilities amidst strong first-quarter earnings and increased fiscal year guidance with contract revenues expected to reach up to US$7.65 billion for fiscal 2027.
- Insights from our recent growth report point to a promising forecast for Dycom Industries' business outlook.
- Delve into the full analysis health report here for a deeper understanding of Dycom Industries.
Seize The Opportunity
- Unlock more gems! Our Undervalued US Stocks Based On Cash Flows screener has unearthed 140 more companies for you to explore.Click here to unveil our expertly curated list of 143 Undervalued US Stocks Based On Cash Flows.
- Are any of these part of your asset mix? Tap into the analytical power of Simply Wall St's portfolio to get a 360-degree view on how they're shaping up.
- Simply Wall St is a revolutionary app designed for long-term stock investors, it's free and covers every market in the world.
Searching for a Fresh Perspective?
- Explore high-performing small cap companies that haven't yet garnered significant analyst attention.
- Diversify your portfolio with solid dividend payers offering reliable income streams to weather potential market turbulence.
- Fuel your portfolio with companies showing strong growth potential, backed by optimistic outlooks both from analysts and management.
This article by Simply Wall St is general in nature. We provide commentary based on historical data and analyst forecasts only using an unbiased methodology and our articles are not intended to be financial advice. It does not constitute a recommendation to buy or sell any stock, and does not take account of your objectives, or your financial situation. We aim to bring you long-term focused analysis driven by fundamental data. Note that our analysis may not factor in the latest price-sensitive company announcements or qualitative material. Simply Wall St has no position in any stocks mentioned.
Have feedback on this article? Concerned about the content? Get in touch with us directly. Alternatively, email editorial-team@simplywallst.com