
Garrett Motion (GTX) Stock Stays Cheap After Its 303% Five Year Run
Garrett Motion stock has logged a very strong 5 year run, yet the current share price of US$28.58 still sits well below what the Discounted Cash Flow (DCF) intrinsic value estimate suggests. This raises the question of how much of the good news is already reflected in the market price.
- Garrett Motion has delivered a total return of about 302.6% over the past 5 years, which makes the current valuation especially important to assess.
- The company’s ability to keep converting its operations into reliable cash flows can support the DCF based valuation, while any pressure on margins or higher capital needs may reduce that implied upside.
- The stock screens as undervalued on 5 out of 6 valuation checks, so the broader assessment leans cheap for investors reviewing its value score.
The issue now is whether Garrett Motion’s recent performance and fundamentals are strong enough to justify the gap between its current price and the intrinsic value estimate.
Is Garrett Motion Still Cheap on Cash Flow?
The Discounted Cash Flow (DCF) model here focuses on the cash Garrett Motion can generate for shareholders over time. The latest twelve month free cash flow is about US$353 million, which feeds into a 2 Stage Free Cash Flow to Equity model that assumes the business keeps growing its cash generation rather than shrinking it.
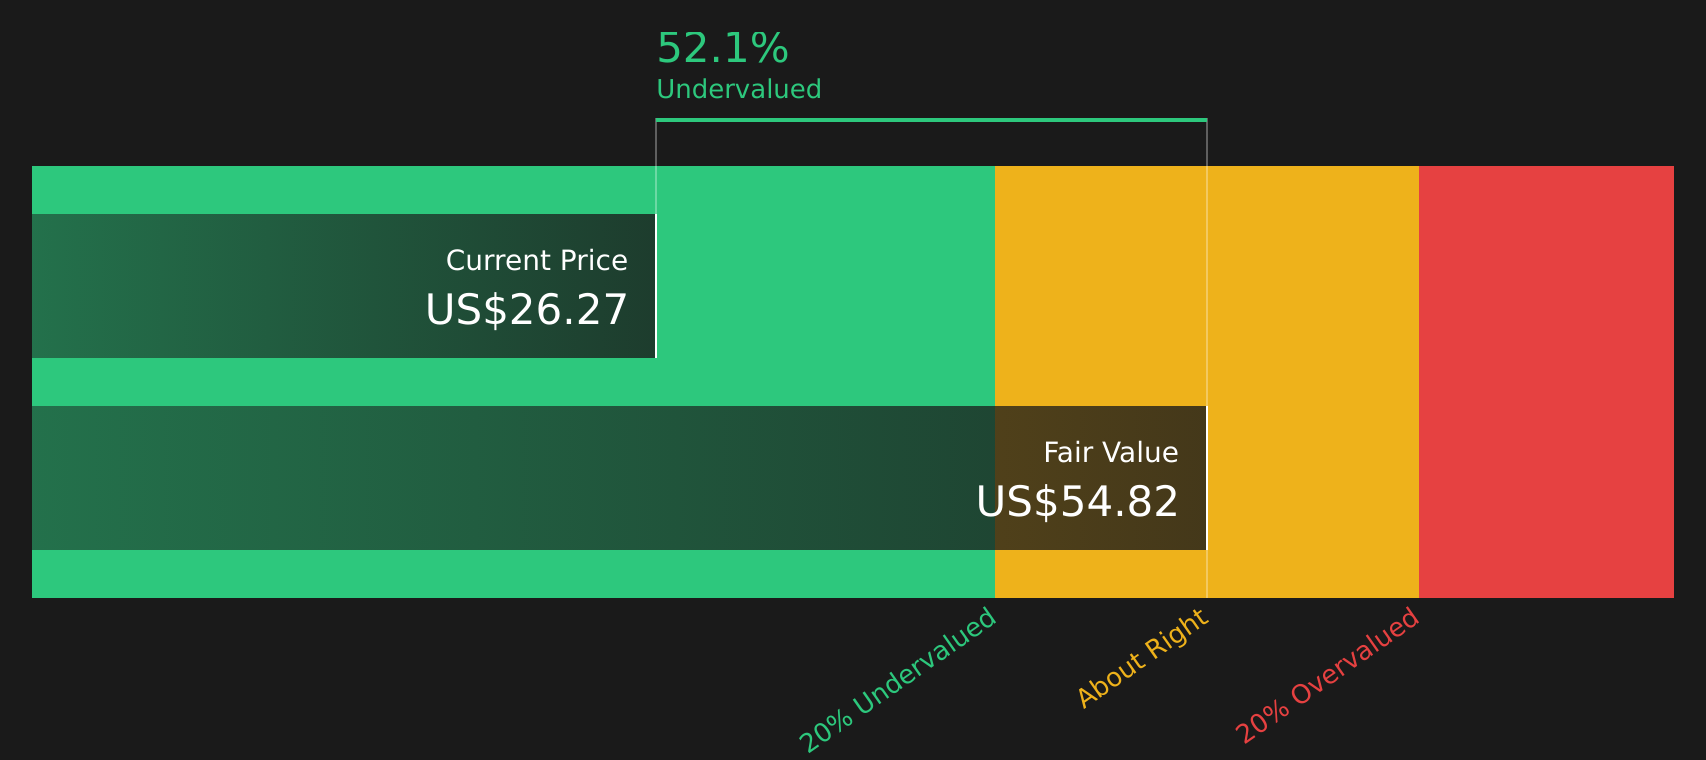
On that basis, the DCF points to an estimated intrinsic value of about $55 per share, compared with the current price near $28.58. That gap implies the stock trades at roughly a 48.4% discount to the model’s value. For investors, the key question is whether Garrett Motion can maintain free cash flow at or above current levels to support this valuation, since the model leans heavily on continued healthy cash conversion.
Putting it together, the DCF outcome suggests Garrett Motion stock currently appears undervalued according to this model.
Our Discounted Cash Flow (DCF) analysis suggests Garrett Motion is undervalued by 48.4%. Track this in your watchlist or portfolio, or discover 53 more high quality undervalued stocks.
Does Garrett Motion Look Undervalued on Earnings?
The P/E ratio is a useful cross check for Garrett Motion because earnings are a key focus for many investors in established, cash generative industrial businesses.
Garrett Motion trades on a P/E of about 14.9x, compared with the Auto Components industry average of around 18.8x and a peer group average near 12.0x. The internal fair P/E for the company is estimated at roughly 18.0x, which is higher than the current multiple. That gap suggests the stock is not pricing in the level of earnings that this framework would imply based on the company’s profile within its sector.
If earnings hold up relative to sector peers, this lower P/E level means the market is attaching a more cautious earnings tag to Garrett Motion than the model suggests.
On this P/E yardstick, Garrett Motion stock appears undervalued compared with both its fair multiple and the wider Auto Components industry.

See what the numbers say about this price — find out in our valuation breakdown.
The Garrett Motion Narrative: What Would Justify Today's Price?
Simply Wall St Narratives for Garrett Motion pick up where this valuation puzzle leaves off and spell out what growth, margin and earnings paths would need to play out for the stock to be worth materially more or less than today’s price. All of this is housed on the company’s Community page. Rather than focusing on a single multiple or model output, each narrative lays out its own set of assumptions so you can compare them with Garrett Motion’s actual results over time.
One of the top community narratives on Garrett Motion: 20% undervalued
"Momentum in newly launched large turbo products for genset and marine applications particularly serving the rapidly expanding data center backup power market provides access to a new, fast-growing revenue stream..."
Read one of the top narratives on Garrett Motion
Do you think there's more to the story for Garrett Motion? Head over to our Community to see what others are saying!
The Bottom Line
Garrett Motion screens as undervalued on both the Discounted Cash Flow (DCF) intrinsic value estimate and its earnings multiple, which gives a consistent message across the two main valuation lenses. The stock trades at a large discount to the intrinsic value estimate and at a lower P/E than the industry, yet broader checks still support the idea that it looks cheap rather than merely optically low. The real hinge from here is whether Garrett Motion can keep converting its operations into solid free cash flow and steady earnings. That will decide whether the current discount reflects opportunity or a market view that risks deserve a lasting penalty.
This article by Simply Wall St is general in nature. We provide commentary based on historical data and analyst forecasts only using an unbiased methodology and our articles are not intended to be financial advice. It does not constitute a recommendation to buy or sell any stock, and does not take account of your objectives, or your financial situation. We aim to bring you long-term focused analysis driven by fundamental data. Note that our analysis may not factor in the latest price-sensitive company announcements or qualitative material. Simply Wall St has no position in any stocks mentioned.
Have feedback on this article? Concerned about the content? Get in touch with us directly. Alternatively, email editorial-team@simplywallst.com