
Musashi Seimitsu Industry (TSE:7220) Following Q1 Earnings Growth Is The Valuation Still Attractive
Q1 2026 earnings snapshot
Musashi Seimitsu Industry (TSE:7220) released first quarter 2026 results that showed sales of ¥89,157 million and net income of ¥1,849 million, compared with ¥83,076 million and ¥1,666 million a year earlier.
See our latest analysis for Musashi Seimitsu Industry.
Musashi Seimitsu Industry shares have moved up in the short term with a 21.62% 1 month share price return and a 42.17% year to date share price return. However, the 3 year total shareholder return of 134.08% and 5 year total shareholder return of 120.31% point to a longer running story where momentum has periodically cooled, including a 25.25% decline over the past 3 months, as investors weigh the latest earnings against previous expectations.
If this earnings move has you looking beyond Musashi Seimitsu Industry, it can be a useful moment to broaden your search and check out 11 top founder-led companies
After a sharp run this year and a recent pullback, Musashi Seimitsu Industry now sits between investors who see further upside and those who think most of the gains are already captured. How does the current valuation stack up against that debate?
Price-to-sales of 0.7x for Musashi Seimitsu Industry: Is it justified?
Musashi Seimitsu Industry last closed at ¥3,685 and is flagged as expensive on a P/S basis, trading at 0.7x compared with peers closer to 0.6x and the broader JP Auto Components industry at 0.4x.
The P/S ratio compares the company’s market value with its annual revenue. For a parts manufacturer like Musashi Seimitsu Industry, this helps show how much investors are paying for each yen of sales when earnings are affected by items such as one off charges.
The current 0.7x P/S sits above both direct peers and the industry average, which suggests the market is paying a higher price for each unit of revenue. However, it is still below the estimated fair P/S ratio of 0.9x. The market could move toward that level if sentiment and fundamentals align more closely with that fair ratio estimate over time.
To see how that benchmark is calculated and where the gaps might be, take a closer look at the Explore the SWS fair ratio for Musashi Seimitsu Industry
Result: Price-to-Sales of 0.7x (ABOUT RIGHT)
However, Musashi Seimitsu Industry still faces pressure from its recent 25.25% three month share price decline and any disappointment versus current fair value assumptions.
Find out about the key risks to this Musashi Seimitsu Industry narrative.
Another view on Musashi Seimitsu Industry valuation
The P/S discussion gives one angle, but the SWS DCF model presents a different perspective for Musashi Seimitsu Industry. At ¥3,685 the stock trades well below an estimated future cash flow value of ¥12,135.53, which highlights a wide gap. Is that a margin of safety, or a sign that expectations are too optimistic?
Look into how the SWS DCF model arrives at its fair value.
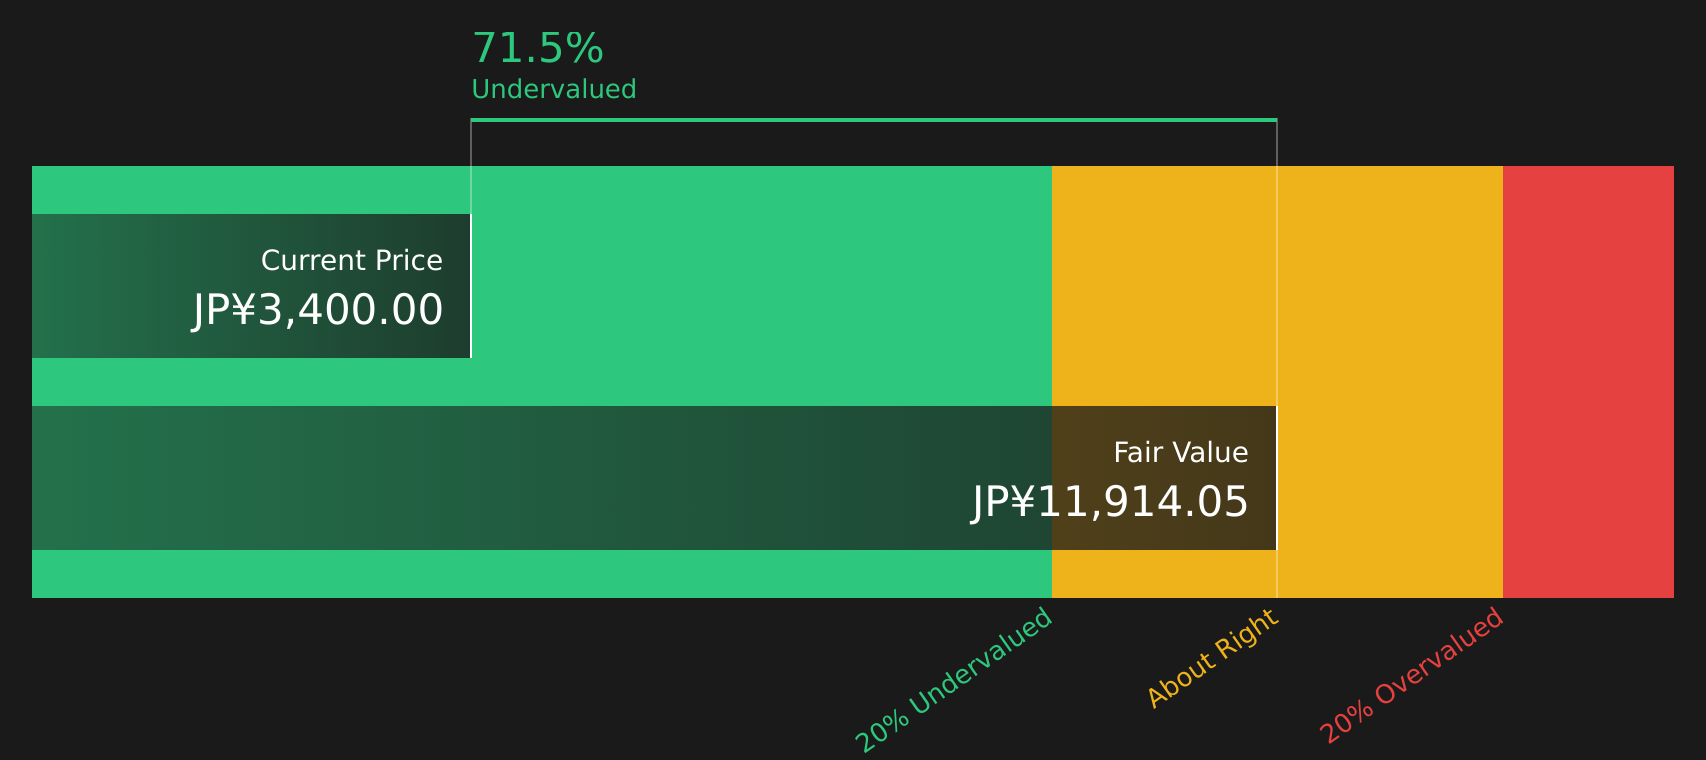
Simply Wall St performs a discounted cash flow (DCF) on every stock in the world every day (check out Musashi Seimitsu Industry for example). We show the entire calculation in full. You can track the result in your watchlist or portfolio and be alerted when this changes, or use our stock screener to discover 23 high quality undervalued stocks. If you save a screener we even alert you when new companies match - so you never miss a potential opportunity.
Next Steps
With Musashi Seimitsu Industry showing both potential and open questions, it helps to move quickly, review the full picture, and weigh the 2 key rewards and 4 important warning signs.
Looking for more Musashi Seimitsu Industry sized opportunities?
If Musashi Seimitsu Industry has sharpened your focus, do not stop here. The right screen today could surface tomorrow's potential winners before the crowd even looks.
- Target quality at a discount and sift through companies that combine strong fundamentals with attractive pricing using the 23 high quality undervalued stocks.
- Prioritise resilience and scan for businesses with healthy finances using the solid balance sheet and fundamentals stocks screener (41 results).
- Hunt for early stage opportunities with solid underpinnings by checking the 1 elite penny stocks with strong financials.
This article by Simply Wall St is general in nature. We provide commentary based on historical data and analyst forecasts only using an unbiased methodology and our articles are not intended to be financial advice. It does not constitute a recommendation to buy or sell any stock, and does not take account of your objectives, or your financial situation. We aim to bring you long-term focused analysis driven by fundamental data. Note that our analysis may not factor in the latest price-sensitive company announcements or qualitative material. Simply Wall St has no position in any stocks mentioned.
Have feedback on this article? Concerned about the content? Get in touch with us directly. Alternatively, email editorial-team@simplywallst.com