
Uncovering Three Undiscovered Gems in Global Markets
In recent weeks, global markets have experienced a mixed performance, with indices like the Russell 2000 and S&P MidCap 400 showing gains amid easing inflation concerns and fluctuating oil prices. As investors navigate these dynamic conditions, identifying promising small-cap stocks that may not yet be on everyone's radar can offer unique opportunities for growth. In this context, finding a good stock often involves looking beyond the headlines to discover companies with strong fundamentals and potential for resilience in uncertain economic climates.
Top 10 Undiscovered Gems With Strong Fundamentals Globally
| Name | Debt To Equity | Revenue Growth | Earnings Growth | Health Rating |
|---|---|---|---|---|
| DeHua TB New Decoration MaterialLtd | 0.63% | 1.50% | 2.14% | ★★★★★★ |
| Envipro Holdings | 39.71% | 0.65% | -14.56% | ★★★★★★ |
| C-Rad | NA | 13.57% | 13.83% | ★★★★★★ |
| GROUPE SFPI | 18.02% | 4.25% | -29.76% | ★★★★★★ |
| CNMC Goldmine Holdings | 2.29% | 35.67% | 73.16% | ★★★★★☆ |
| Fourth Milling | NA | 12.93% | 16.76% | ★★★★★☆ |
| uSonar | 5.92% | 15.94% | 37.41% | ★★★★★☆ |
| Skue Sparebank | 122.31% | 16.16% | 33.20% | ★★★★☆☆ |
| Sing Investments & Finance | 0.10% | 5.85% | 7.00% | ★★★★☆☆ |
| Shengda ResourcesLtd | 57.58% | 8.61% | 9.90% | ★★★☆☆☆ |
Here's a peek at a few of the choices from the screener.
ITAB Group (OM:ITAB)
Simply Wall St Value Rating: ★★★★☆☆
Overview: ITAB Group AB (publ) specializes in developing, manufacturing, selling, and installing store concepts for retail chain stores with a market capitalization of approximately SEK3.85 billion.
Operations: ITAB Group generates revenue primarily from its Furniture & Fixtures segment, which accounts for SEK12.84 billion. The company's financial performance is highlighted by a focus on this core segment, contributing significantly to its overall revenue streams.
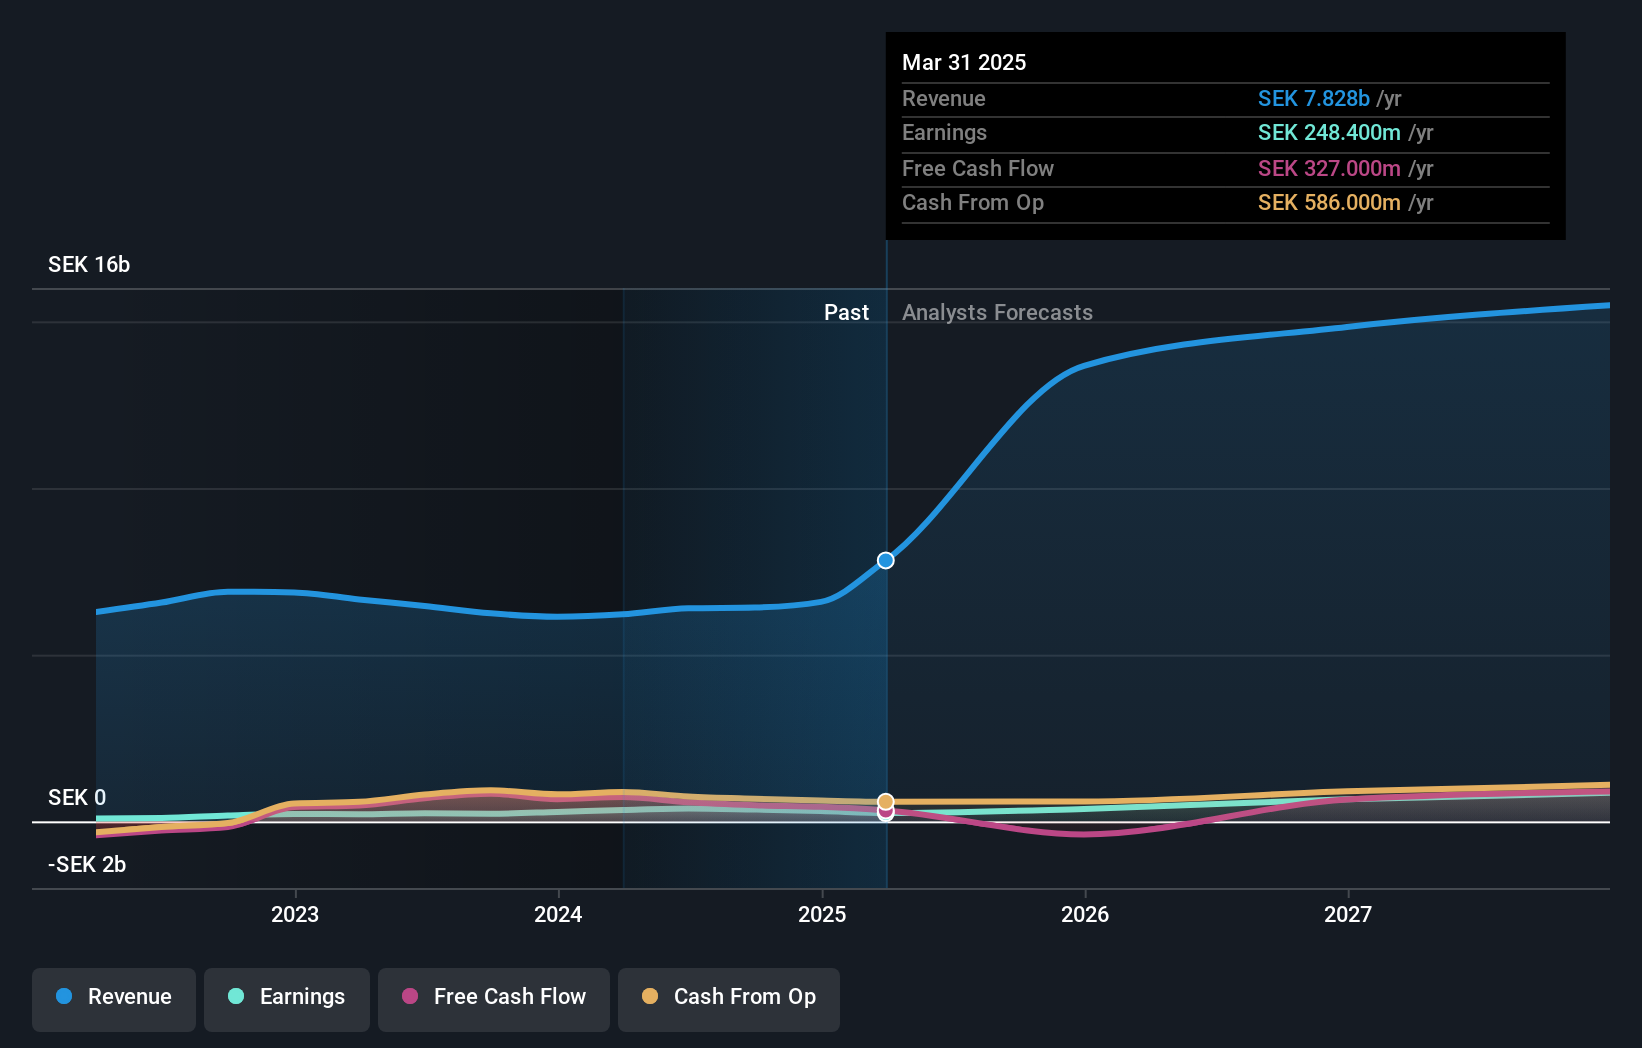
ITAB Group, a small cap player in the commercial services sector, is trading at 78.3% below its estimated fair value, presenting a potential opportunity for investors. Over the past five years, earnings have grown by 17.1% annually, though recent growth of 18.1% lagged behind the industry's 22%. The company's debt to equity ratio has risen from 32.3% to a high of 71.4%, but interest payments are well covered with EBIT at 4.9 times coverage. Recent developments include a EUR8 million agreement for retail solutions across Europe and an acquisition expected to double revenue and diversify its customer base.
Jangho Group (SHSE:601886)
Simply Wall St Value Rating: ★★★★★★
Overview: Jangho Group Co., Ltd. operates in the building decoration and medical health sectors both within China and internationally, with a market cap of CN¥14.45 billion.
Operations: Jangho Group generates revenue from its building decoration and medical health businesses. The company focuses on optimizing its cost structure, which impacts its financial performance. Notably, it has experienced variations in its gross profit margin over time.
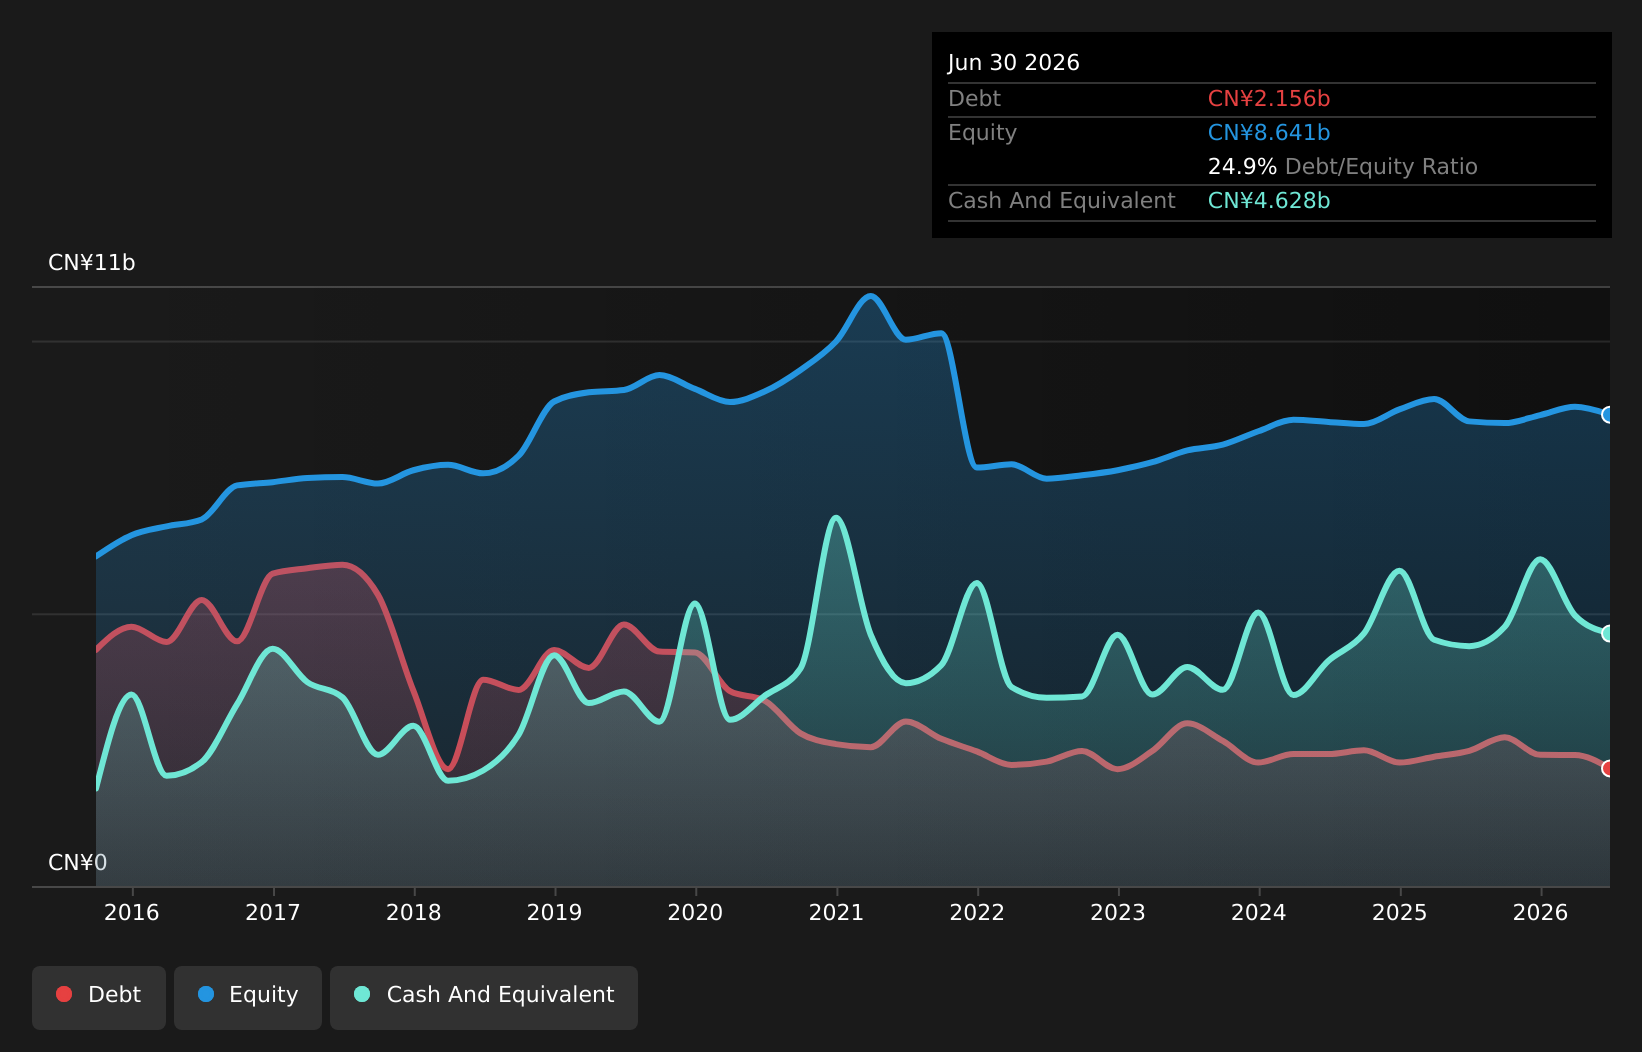
Jangho Group, a player in the construction industry, seems to be trading at 42.1% below its estimated fair value, offering potential upside for investors. The company's earnings grew by 12.4% over the past year, outpacing the industry's -7.1%, and are forecasted to grow by 22.14% annually. Despite a one-off loss of CN¥273M impacting recent results, Jangho's debt situation looks favorable with more cash than total debt and a reduced debt-to-equity ratio from 30.1% to 24.9% over five years. Recent half-year sales increased to CN¥10,823M from CN¥9,339M last year, with net income rising to CN¥441M from CN¥328M.
- Click to explore a detailed breakdown of our findings in Jangho Group's health report.
Explore historical data to track Jangho Group's performance over time in our Past section.
Zhejiang Runtu (SZSE:002440)
Simply Wall St Value Rating: ★★★★★★
Overview: Zhejiang Runtu Co., Ltd. is involved in the production and sale of dyes both in China and internationally, with a market capitalization of CN¥14.43 billion.
Operations: Zhejiang Runtu generates revenue primarily from its specialty chemical segment, which accounts for CN¥5.76 billion. The company's market capitalization stands at CN¥14.43 billion.
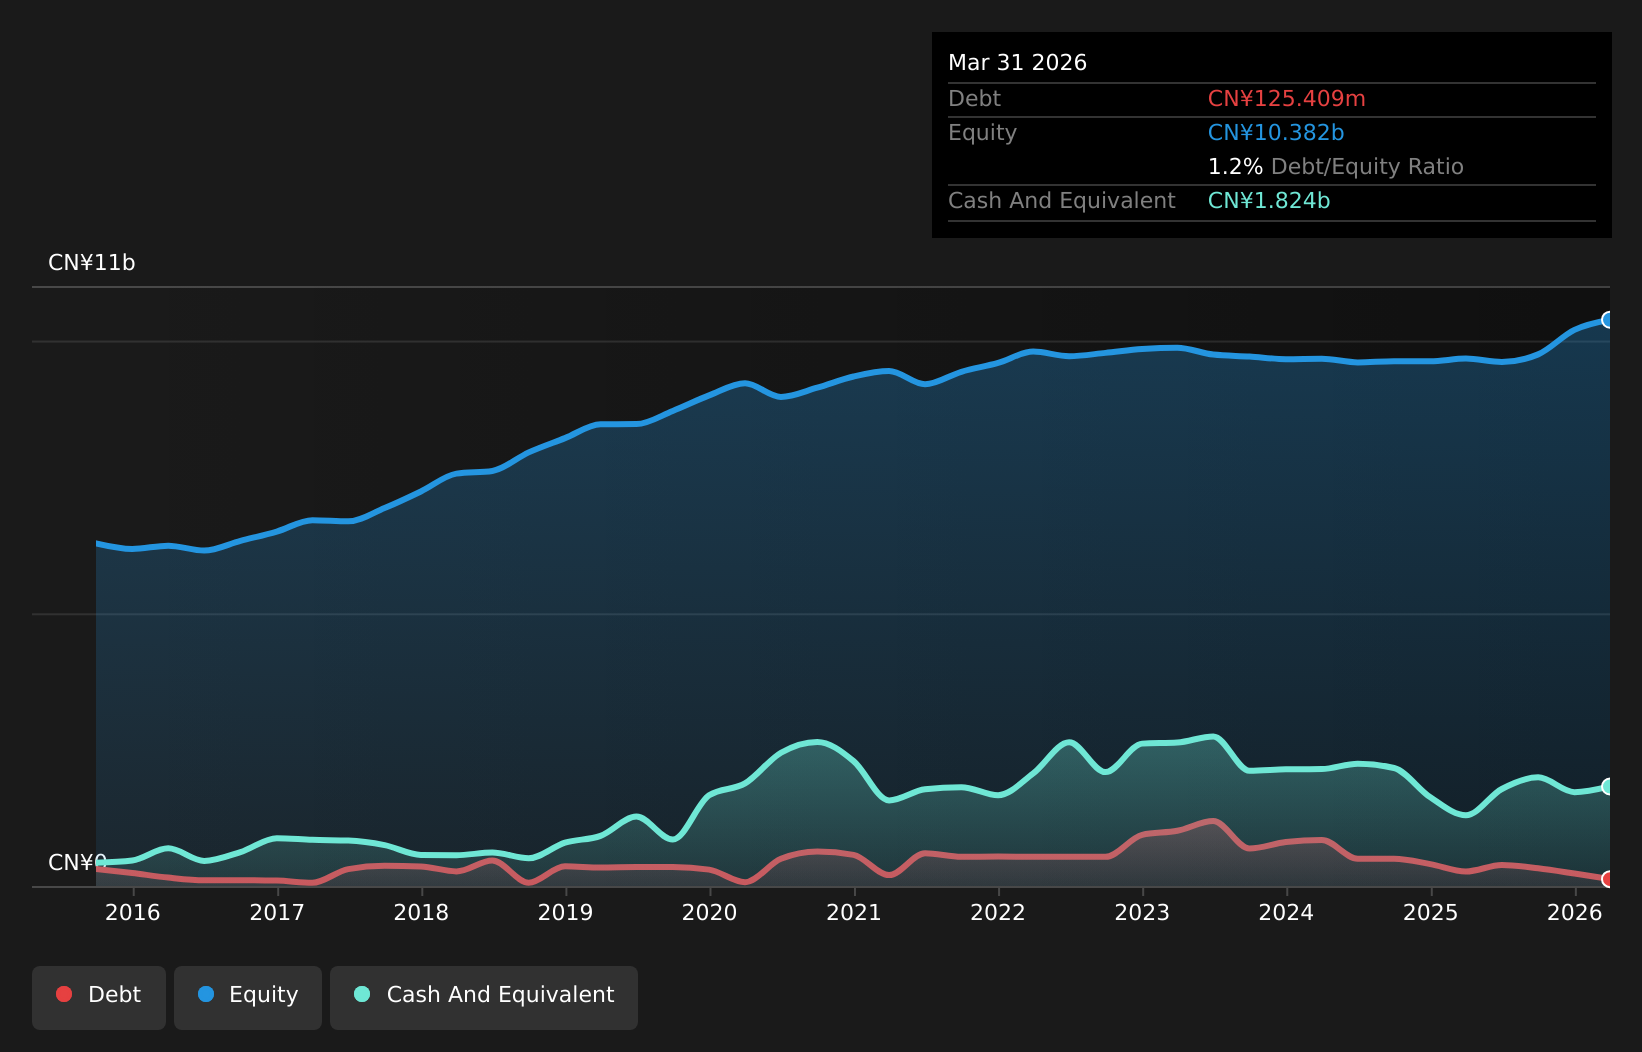
Zhejiang Runtu, a notable player in the chemical industry, has been making waves with its impressive earnings growth of 209.8% over the past year, far outpacing the industry's 4.6%. Trading at a significant discount of 56.1% below its estimated fair value, it seems well-positioned for value seekers. Despite a volatile share price recently, this company is financially sound with more cash than total debt and a reduced debt-to-equity ratio from 2.1 to 1.2 over five years. The recent approval of a CNY 2 dividend per 10 A shares highlights its commitment to rewarding shareholders while maintaining high-quality earnings and positive free cash flow.
- Click here and access our complete health analysis report to understand the dynamics of Zhejiang Runtu.
Evaluate Zhejiang Runtu's historical performance by accessing our past performance report.
Summing It All Up
- Discover the full array of 164 Global Undiscovered Gems With Strong Fundamentals right here.
- Have you diversified into these companies? Leverage the power of Simply Wall St's portfolio to keep a close eye on market movements affecting your investments.
- Take control of your financial future using Simply Wall St, offering free, in-depth knowledge of international markets to every investor.
Contemplating Other Strategies?
- Explore high-performing small cap companies that haven't yet garnered significant analyst attention.
- Fuel your portfolio with companies showing strong growth potential, backed by optimistic outlooks both from analysts and management.
- Find companies with promising cash flow potential yet trading below their fair value.
This article by Simply Wall St is general in nature. We provide commentary based on historical data and analyst forecasts only using an unbiased methodology and our articles are not intended to be financial advice. It does not constitute a recommendation to buy or sell any stock, and does not take account of your objectives, or your financial situation. We aim to bring you long-term focused analysis driven by fundamental data. Note that our analysis may not factor in the latest price-sensitive company announcements or qualitative material. Simply Wall St has no position in any stocks mentioned.
Have feedback on this article? Concerned about the content? Get in touch with us directly. Alternatively, email editorial-team@simplywallst.com