
Keppel DC REIT (SGX:AJBU) Lifted H1 2026 Distributions, Is The Discount To Fair Value Justified?
Keppel DC REIT (SGX:AJBU) drew investor attention after reporting an 11.3% year-on-year rise in H1 2026 distributions per unit, supported by stronger rental reversions and a portfolio occupancy rate of 92.5%.
See our latest analysis for Keppel DC REIT.
Keppel DC REIT’s recent H1 2026 distribution update comes after a mixed share price trend, with the stock at SGD2.23 showing modest positive short term momentum but softer 30 day and year to date share price returns, alongside solid multi year total shareholder returns.
If this data centre focused REIT has caught your attention, it can be useful to see what other infrastructure enablers of AI are doing through a curated list of 56 AI infrastructure stocks
Keppel DC REIT now trades at a double digit discount to both analyst targets and an intrinsic value estimate, even after the recent rebound. Does that gap reflect mispricing or reasonable caution about its income profile and growth plans?
Price-to-Earnings of 12.2x: Is it justified?
On current numbers Keppel DC REIT trades on a P/E of 12.2x, which screens as good value compared with both its peers and the wider Specialized REITs industry.
The P/E ratio compares the SGD2.23 unit price with the REIT’s earnings per unit. For data centre focused REITs, this is a common way investors gauge how much they are paying for each dollar of profit.
Here, the 12.2x P/E sits below the global Specialized REITs industry average of 16.3x and also below the peer average of 16.5x. It is even under the estimated fair P/E of 14.5x, which is the level our models suggest the market could reasonably move toward if pricing fully reflected the underlying earnings profile.
This discount aligns with the SWS DCF model, which values Keppel DC REIT at SGD2.70 per unit compared with the current SGD2.23, pointing to a 17.7% gap to that cash flow based estimate.
Explore the SWS fair ratio for Keppel DC REIT
Result: Price-to-Earnings of 12.2x (UNDERVALUED)
However, you also need to weigh risks such as an annual net income contraction of 5.2%, and softer 30-day and year-to-date share price performance for Keppel DC REIT.
Find out about the key risks to this Keppel DC REIT narrative.
Another View on Keppel DC REIT’s Value
The SWS DCF model also indicates Keppel DC REIT trades below an estimated fair value of SGD2.70 per unit, compared with the current SGD2.23 price. That points to a 17.7% gap. Is the market being overly cautious or correctly pricing future income risks?
Look into how the SWS DCF model arrives at its fair value.
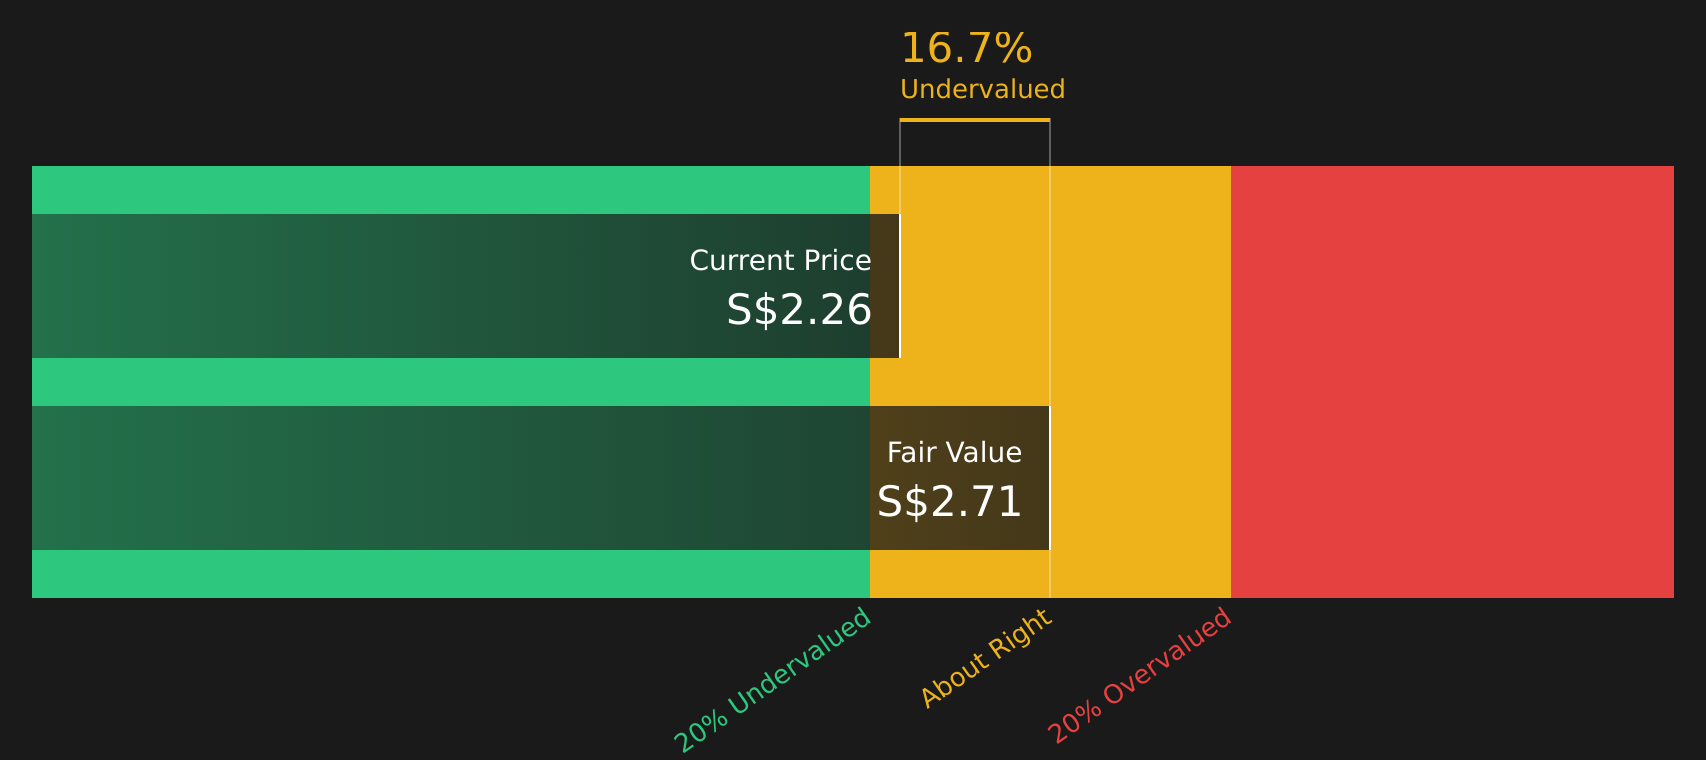
Simply Wall St performs a discounted cash flow (DCF) on every stock in the world every day (check out Keppel DC REIT for example). We show the entire calculation in full. You can track the result in your watchlist or portfolio and be alerted when this changes, or use our stock screener to discover 265 high quality undervalued stocks. If you save a screener we even alert you when new companies match - so you never miss a potential opportunity.
Next Steps
If the mixed signals on Keppel DC REIT leave you unsure, check the numbers yourself and decide quickly where you stand on this balance of risks and rewards. To frame that view with a concise checklist, review the 3 key rewards and 4 important warning signs
Looking for more investment ideas beyond Keppel DC REIT?
If Keppel DC REIT has sharpened your focus on valuations and income, do not stop there. The broader market holds other opportunities that could fit your goals.
- Target quality at a discount by checking companies that currently appear mispriced relative to fundamentals through the 265 high quality undervalued stocks.
- Strengthen your income stream by scanning businesses with robust payouts and higher yields via the 433 dividend fortresses.
- Protect your portfolio with companies that show resilient profiles and lower overall risk scores using the 290 resilient stocks with low risk scores.
This article by Simply Wall St is general in nature. We provide commentary based on historical data and analyst forecasts only using an unbiased methodology and our articles are not intended to be financial advice. It does not constitute a recommendation to buy or sell any stock, and does not take account of your objectives, or your financial situation. We aim to bring you long-term focused analysis driven by fundamental data. Note that our analysis may not factor in the latest price-sensitive company announcements or qualitative material. Simply Wall St has no position in any stocks mentioned.
Have feedback on this article? Concerned about the content? Get in touch with us directly. Alternatively, email editorial-team@simplywallst.com