
BIG Shopping Centers (TASE:BIG) Just Gave Investors Something To Think About
BIG Shopping Centers (TASE:BIG) drew investor attention after reporting Q2 2026 net profit of ₪366.3 million and full mall occupancy. The results were influenced by a higher fair value of its investment real estate portfolio.
See our latest analysis for BIG Shopping Centers.
The Q2 2026 earnings call appears to have given BIG Shopping Centers some short term momentum, with a 7 day share price return of 4.48% helping to offset a year to date share price decline of 9.84%. The 3 year total shareholder return of 117.72% points to a very strong longer term result compared with the recent 90 day share price decline of 4.79%.
If you want to see what else is moving, this could be a good moment to broaden your search and uncover 110 top founder-led companies
BIG Shopping Centers has just reported strong profit figures helped by higher property valuations and the share price has started to react. With estimates and intrinsic value signals pointing in different directions, the question is where fair value now appears to be anchored.
Preferred P/E of 11.5x for BIG Shopping Centers: Is it justified?
BIG Shopping Centers is trading on a P/E of 11.5x based on its latest earnings, which is below both the wider IL market and its real estate peers. At a last close of ₪689.6, that valuation points to the market applying a modest discount to the company’s recent profit stream.
The P/E multiple compares the current share price with earnings per share. For a property owner and developer like BIG Shopping Centers, it reflects what investors are willing to pay today for each unit of recent profit, including the effect of fair value remeasurements on its investment portfolio.
BIG Shopping Centers is on a lower P/E than the IL market average of 14.8x, which suggests the market is pricing its earnings more cautiously than the broader market. Against the IL Real Estate industry average of 12.7x and a peer average of 12.9x, the company’s 11.5x multiple is also cheaper, indicating investors are not paying up relative to sector peers based on current earnings.
See what the numbers say about this price — find out in our valuation breakdown.
Result: Price-to-Earnings of 11.5x (ABOUT RIGHT)
However, investors also need to watch for shifts in property valuations and rental demand, since either could quickly change how comfortable that 11.5x P/E looks.
Find out about the key risks to this BIG Shopping Centers narrative.
Another view on BIG Shopping Centers using the SWS DCF model
The latest SWS DCF model points in a very different direction for BIG Shopping Centers. With an estimated fair value of ₪181.75 per share against a market price of ₪689.6, the stock screens as significantly overvalued on this measure. That leaves a clear question for investors: Which signal deserves more weight, the earnings multiple or the cash flow model?
Look into how the SWS DCF model arrives at its fair value.
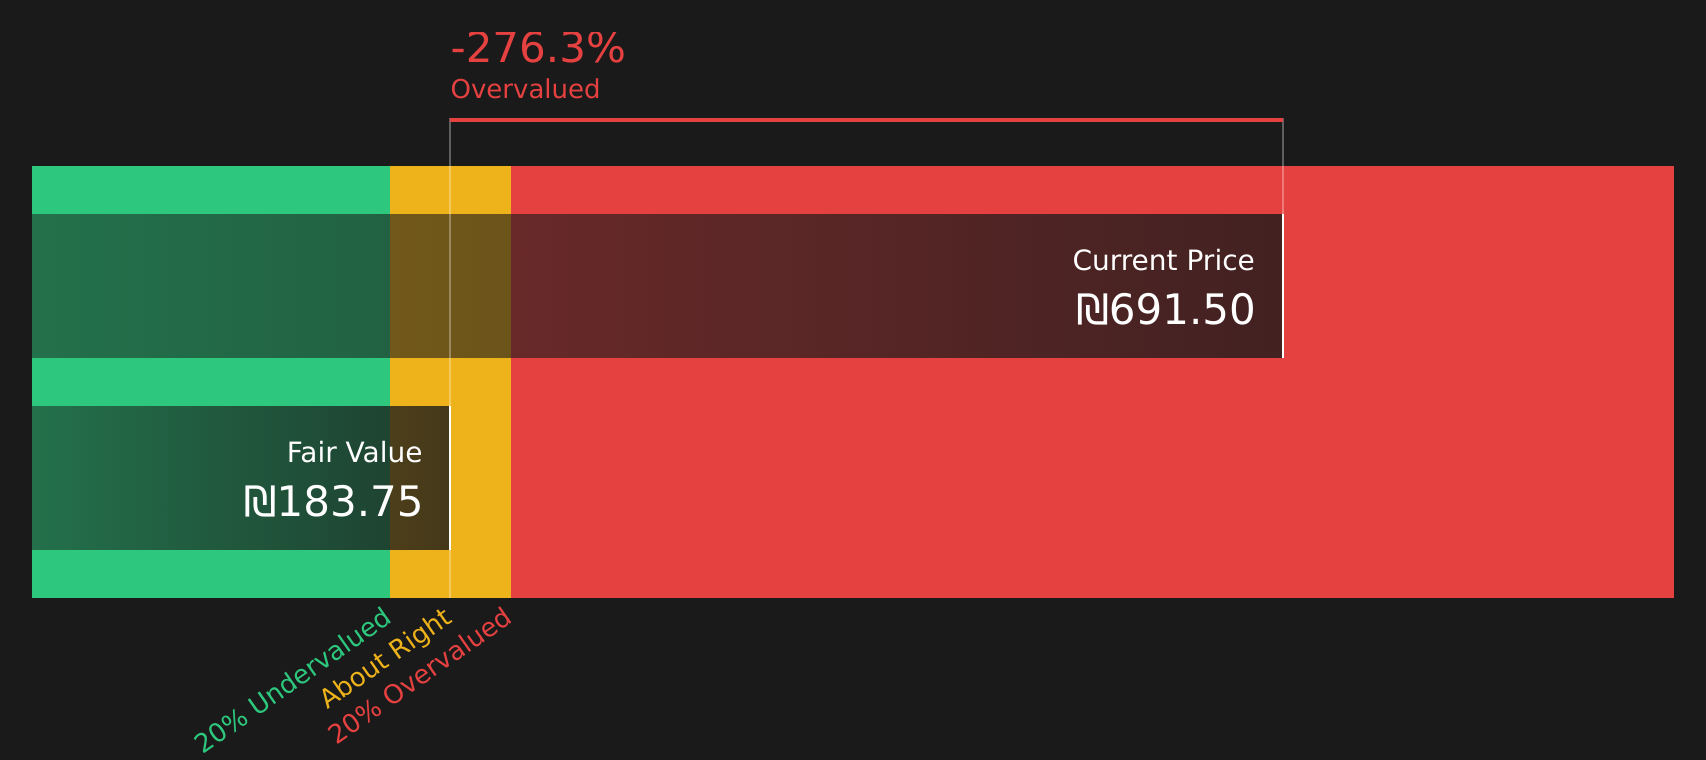
Simply Wall St performs a discounted cash flow (DCF) on every stock in the world every day (check out BIG Shopping Centers for example). We show the entire calculation in full. You can track the result in your watchlist or portfolio and be alerted when this changes, or use our stock screener to discover 277 high quality undervalued stocks. If you save a screener we even alert you when new companies match - so you never miss a potential opportunity.
Next Steps
With BIG Shopping Centers sending mixed signals on valuation, this is a moment to move quickly and test the story against your own expectations. Before you decide how to treat the recent profit figures and fair value estimates, it can help to set them against 1 key reward and 3 important warning signs
Looking for more investment ideas beyond BIG Shopping Centers?
If BIG Shopping Centers has sharpened your focus on valuation, now is the time to widen your watchlist and compare it with other potential opportunities.
- Target potential mispricing by scanning for companies that combine quality fundamentals with lower valuations using the 277 high quality undervalued stocks.
- Strengthen your search for income by reviewing stocks that offer higher yields and consistency through the 433 dividend fortresses.
- Protect your downside by focusing on companies that score well on resilience using the 291 resilient stocks with low risk scores.
This article by Simply Wall St is general in nature. We provide commentary based on historical data and analyst forecasts only using an unbiased methodology and our articles are not intended to be financial advice. It does not constitute a recommendation to buy or sell any stock, and does not take account of your objectives, or your financial situation. We aim to bring you long-term focused analysis driven by fundamental data. Note that our analysis may not factor in the latest price-sensitive company announcements or qualitative material. Simply Wall St has no position in any stocks mentioned.
Have feedback on this article? Concerned about the content? Get in touch with us directly. Alternatively, email editorial-team@simplywallst.com