
Can Harmonic Drive Systems (TSE:6324) Justify Its Valuation On Raised Earnings Guidance?
Harmonic Drive Systems (TSE:6324) drew fresh investor attention after raising earnings guidance for the six months to September 2026 and the full year to March 2027, citing stronger expectations for sales and profits.
See our latest analysis for Harmonic Drive Systems.
Harmonic Drive Systems’ share price has retreated over the past quarter, with a 30 day share price return of down 11.26% and a 90 day share price return of down 16.83%. However, the year to date share price return is 51.82% and the 1 year total shareholder return is 131.87%, which points to strong recent gains but fading short term momentum.
If this earnings guidance update has you thinking about other robotics and automation opportunities, it could be a good time to review the 38 robotics and automation stocks.
Harmonic Drive Systems has raised its earnings outlook, yet the share price has cooled in recent weeks, which leaves you weighing two paths: lean into the guidance upgrade now, or wait in case sentiment weakens further and improves the entry point.
Preferred Price-to-Sales Multiple of 8.8x: Is it justified?
Harmonic Drive Systems trades on a Price-to-Sales (P/S) ratio of 8.8x, which is well above several reference points and raises clear questions about how much future growth is already reflected in the ¥5,830 share price.
The P/S ratio compares a company’s market value to its revenue. For a company like Harmonic Drive Systems, which manufactures high precision speed reducers and mechatronics products for industrial robots and semiconductor equipment, investors often look at P/S to gauge how much they are paying for each unit of current sales when near term earnings are uneven or margins are under pressure.
On that measure, the current 8.8x P/S is described as expensive compared to the JP Machinery industry average of 0.9x and also expensive relative to the peer average of 1.3x. It is also high versus the estimated fair P/S ratio of 2.1x, which suggests a level the market could move towards if expectations around growth and profitability reset closer to that fair multiple.
Explore the SWS fair ratio for Harmonic Drive Systems
Result: Price-to-Sales of 8.8x (OVERVALUED)
However, the high 8.8x P/S leaves Harmonic Drive Systems exposed if robotics or semiconductor equipment demand slows, or if margins fail to support the upgraded guidance.
Find out about the key risks to this Harmonic Drive Systems narrative.
Another view on Harmonic Drive Systems’ valuation
The SWS DCF model paints a different picture for Harmonic Drive Systems. At a share price of ¥5,830, the stock is trading well above the model’s future cash flow value estimate of ¥2,274.84. That points to an overvalued signal using this cash flow based approach. It leaves you asking which story to trust: the rich P/S multiple or a more conservative cash flow view.
Look into how the SWS DCF model arrives at its fair value.
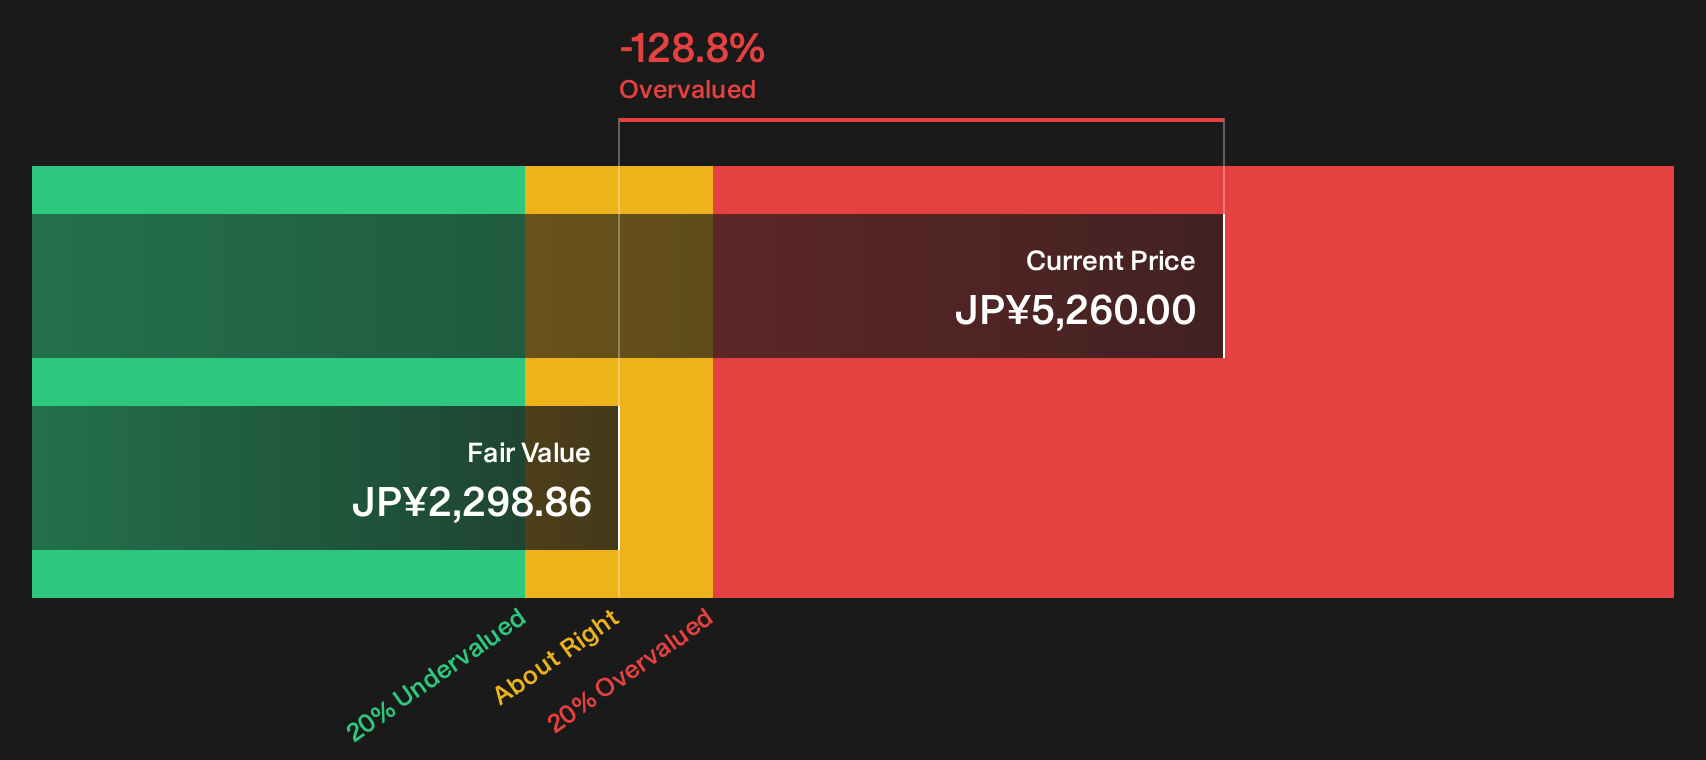
Simply Wall St performs a discounted cash flow (DCF) on every stock in the world every day (check out Harmonic Drive Systems for example). We show the entire calculation in full. You can track the result in your watchlist or portfolio and be alerted when this changes, or use our stock screener to discover 26 high quality undervalued stocks. If you save a screener we even alert you when new companies match - so you never miss a potential opportunity.
Next Steps
The mixed signals around Harmonic Drive Systems mean sentiment is far from one sided, so consider this guidance shift while it is still recent and reach your own conclusion. To weigh up both sides of the story, start by checking the 1 key reward and 1 important warning sign.
Looking for more Harmonic Drive Systems investment ideas?
Harmonic Drive Systems may be on your radar, but the market always offers more potential opportunities. Use fresh ideas from focused screeners so you are not relying on a single stock story.
Broaden your watchlist with targeted filters that highlight different strengths and risk profiles across the market.
- Spot potential high growth stories early by scanning the 1 elite penny stocks with strong financials that already show stronger financial underpinnings than many micro caps.
- Zero in on quality at a reasonable price with the 26 high quality undervalued stocks that filters for solid companies trading below their estimated worth.
- Prioritise resilience and financial strength using the solid balance sheet and fundamentals stocks screener (41 results) so you focus on businesses that may better handle tougher conditions.
This article by Simply Wall St is general in nature. We provide commentary based on historical data and analyst forecasts only using an unbiased methodology and our articles are not intended to be financial advice. It does not constitute a recommendation to buy or sell any stock, and does not take account of your objectives, or your financial situation. We aim to bring you long-term focused analysis driven by fundamental data. Note that our analysis may not factor in the latest price-sensitive company announcements or qualitative material. Simply Wall St has no position in any stocks mentioned.
Have feedback on this article? Concerned about the content? Get in touch with us directly. Alternatively, email editorial-team@simplywallst.com