
Berkshire Hathaway (BRK.B) Stock May Still Be Undervalued After Recent Moves
Berkshire Hathaway stock has delivered a 74.2% return over the past 5 years, yet current valuation work suggests the shares may still trade below an intrinsic value estimate based on an Excess Returns model and market multiples that both point to an undervalued profile.
- A 74.2% gain over 5 years indicates Berkshire Hathaway has already rewarded patient holders, which makes the current suggestion of further undervaluation more important for anyone thinking about adding or trimming.
- The recent step up in capital deployment, including a larger position in Alphabet and increased buybacks, can support the long term earnings power that underpins valuation. At the same time, softer insurance underwriting results highlight that profitability in a key business line may pressure that outlook if conditions stay challenging.
- Berkshire Hathaway screens as undervalued on 5 of 6 key checks, so the broader valuation work leans toward the shares being cheap rather than fairly priced or expensive.
The issue now is whether Berkshire Hathaway's current share price already reflects this stronger capital allocation phase or still leaves a meaningful margin against the intrinsic value estimate.
Is Berkshire Hathaway a Bargain on Excess Returns?
The Excess Returns model for Berkshire Hathaway looks at how much profit the company can earn on its equity above the required cost of that equity. For Berkshire Hathaway, that excess is a key part of the intrinsic value story.
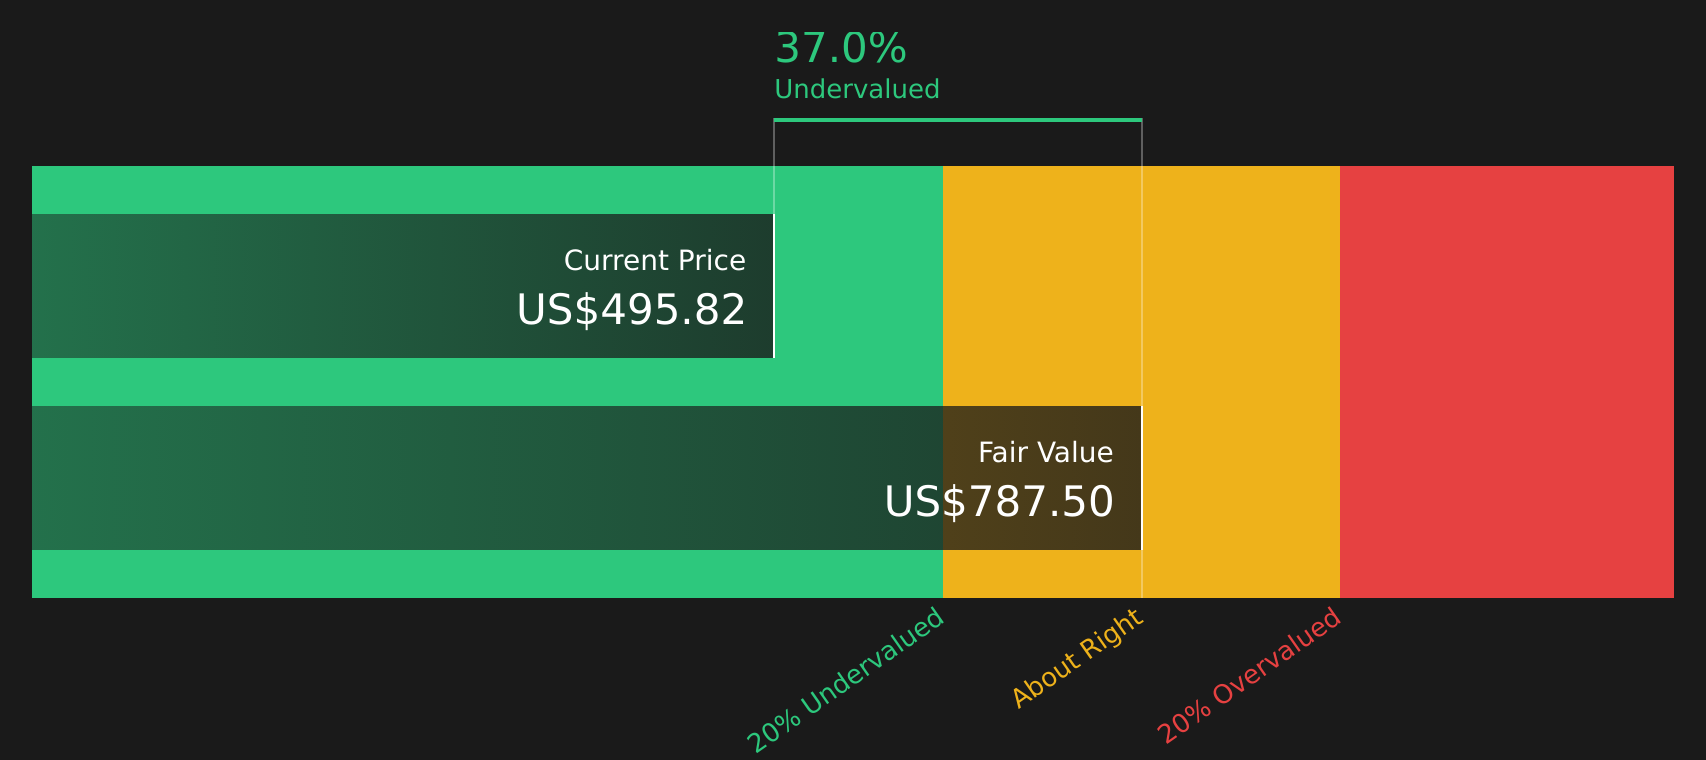
The model uses a book value of $522,225.90 per share and a stable earnings figure of $65,244.04 per share, based on the median return on equity from the past 5 years. Against a cost of equity of $41,152.70 per share, this implies an excess return of $24,091.35 per share and an average return on equity of 11.91%. Analysts also point to a stable book value of $547,710.90 per share from weighted future book value estimates. All of this feeds into an Excess Returns valuation of $787.02 per share. This valuation is above the current share price and indicates the stock screens as undervalued by about 36.9%.
Berkshire Hathaway’s more active capital deployment under Greg Abel, including the sizeable Alphabet investment and large buybacks, helps explain why the Excess Returns model supports an intrinsic value above where the market is pricing the stock.
On this Excess Returns view, Berkshire Hathaway stock currently looks undervalued relative to its estimated intrinsic value.
Our Excess Returns analysis suggests Berkshire Hathaway is undervalued by 36.9%. Track this in your watchlist or portfolio, or discover 50 more high quality undervalued stocks.
Is Berkshire Hathaway Still Cheap on Earnings?
The P/E ratio is a useful cross-check for Berkshire Hathaway because it links the share price directly to the earnings power that underpins the Excess Returns work above.
The stock trades on a P/E of 12.4x, which is below both the diversified financial industry average of 17.4x and the broader peer average of 23.2x. A fair P/E ratio that incorporates Berkshire Hathaway’s size, profitability profile and risk comes out at 16.5x. That is several turns higher than the current multiple and indicates a valuation gap rather than a small noise band.
On this framework, the shares trade at a discount to where the P/E might sit if the market priced Berkshire Hathaway closer to that fair ratio benchmark. The multiple suggests investors are not paying up for the current earnings base compared with similar financial companies.
On the P/E multiple, Berkshire Hathaway stock appears undervalued relative to both industry peers and its modelled fair ratio.

See what the numbers say about this price — find out in our valuation breakdown.
The Berkshire Hathaway Narrative: What Would Justify Today's Price?
Simply Wall St Narratives pick up where Berkshire Hathaway's valuation puzzle leaves off by spelling out which future paths for growth, margins and earnings would need to hold for the stock to be worth significantly more or less than today's price, and they sit on Simply Wall St's Community page. Rather than a single multiple or model output, each one lays out the assumptions behind its fair value so you can compare them with actual results as they come through.
You can add your voice to the Simply Wall St community by sharing a Berkshire Hathaway Narrative that lays out your number driven case and the assumptions behind it. Put your view on whether Berkshire Hathaway's larger Alphabet stake and recent capital deployment deliver against the current share price, then track how that thesis holds up as new results arrive.
Do you think there's more to the story for Berkshire Hathaway? Head over to our Community to see what others are saying!
The Bottom Line
Berkshire Hathaway screens as undervalued on both the Excess Returns intrinsic value estimate and on market multiples, with each method pointing to a similar discount. That alignment, backed by strong broader valuation checks, suggests the key question now is whether earnings power and capital deployment can sustain the assumptions behind that intrinsic value. For investors, the crux is whether current insurance and underwriting risks are temporary or more structural. How that plays out will likely decide whether the present discount reflects an opportunity or a fair caution on the stock.
This article by Simply Wall St is general in nature. We provide commentary based on historical data and analyst forecasts only using an unbiased methodology and our articles are not intended to be financial advice. It does not constitute a recommendation to buy or sell any stock, and does not take account of your objectives, or your financial situation. We aim to bring you long-term focused analysis driven by fundamental data. Note that our analysis may not factor in the latest price-sensitive company announcements or qualitative material. Simply Wall St has no position in any stocks mentioned.
Have feedback on this article? Concerned about the content? Get in touch with us directly. Alternatively, email editorial-team@simplywallst.com