
Apollo Global Management (APO) Could Be 22% Undervalued Following NVIDIA AI Infrastructure Deal
Apollo Global Management (APO) has moved into the AI infrastructure story after NVIDIA announced a partnership framework that includes Apollo among six large financing institutions to help mobilize over US$500b of third party capital.
See our latest analysis for Apollo Global Management.
The NVIDIA partnership news comes as Apollo Global Management trades at US$132.69, with a 30 day share price return of 11.47% but a year to date share price decline of 9.49%. The 5 year total shareholder return of 149.24% points to strong longer term compounding and suggests momentum has recently been rebuilding after a softer patch.
If this AI infrastructure story has your attention, it can be useful to see what else is moving in similar areas by scanning 55 AI infrastructure stocks
Bulls see Apollo Global Management using the NVIDIA partnership and its broad credit platform to justify a richer multiple. Bears point to recent share price swings and legal overhangs. Which story do the current valuation numbers back up next?
Preferred P/E Multiple of 41.5x: Is It Justified for Apollo Global Management?
Apollo Global Management is currently valued at a P/E of 41.5x, which points to a richer price tag compared to much of the US Diversified Financial industry.
The P/E multiple compares the current share price to earnings per share. For a firm like Apollo Global Management that is focused on asset management, credit and alternative investments, this ratio often reflects what investors are willing to pay today for the earnings power they expect over time.
Analysts are expecting earnings to grow significantly in the coming years, with forecasts indicating around 30.6% annual profit growth, which is faster than the wider US market. However, this optimism sits against some mixed recent metrics. Earnings declined over the last year and net profit margins moved down from 13.7% to 5.3%. That mix can leave investors asking whether the current 41.5x multiple is already pricing in a lot of the future earnings recovery story.
Compared to the US Diversified Financial industry average P/E of 17.4x, Apollo Global Management trades at a much higher level. The stock is also above the estimated fair P/E of 26.9x that the SWS model suggests could be a level the market might move toward over time. Even though Apollo screens as better value when compared to a peer average P/E of 47.9x, the gap to both the industry and the fair ratio implies investors are paying a premium.
Explore the SWS fair ratio for Apollo Global Management
Result: Price-to-Earnings of 41.5x (OVERVALUED)
However, investors still face risks that could challenge the Apollo Global Management story, including recent revenue contraction and any escalation of existing legal overhangs.
Find out about the key risks to this Apollo Global Management narrative.
Another View On Apollo Global Management's Value
The SWS DCF model takes a different angle and values Apollo Global Management at $169.03 per share, compared to the current $132.69 price. That 21.5% discount flags potential upside based on future cash flows. Does this cash flow view matter more to you than today's rich P/E multiple?
Look into how the SWS DCF model arrives at its fair value.
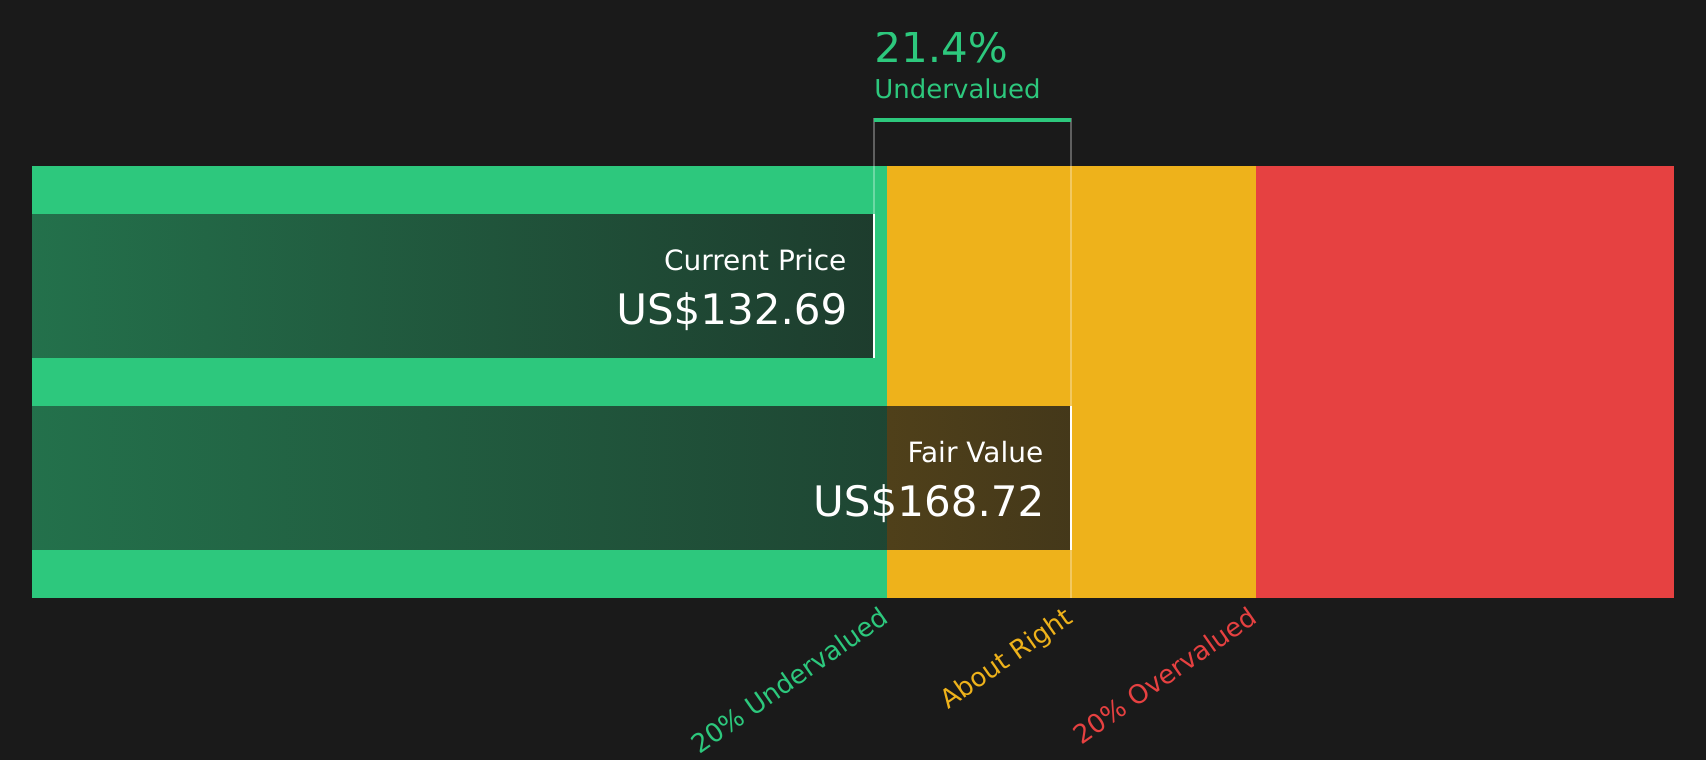
Simply Wall St performs a discounted cash flow (DCF) on every stock in the world every day (check out Apollo Global Management for example). We show the entire calculation in full. You can track the result in your watchlist or portfolio and be alerted when this changes, or use our stock screener to discover 48 high quality undervalued stocks. If you save a screener we even alert you when new companies match - so you never miss a potential opportunity.
Next Steps
With both risks and rewards in play for Apollo Global Management, it makes sense to act now and review the numbers yourself to see where you stand. To consider both sides in one place, review the 2 key rewards and 3 important warning signs
Looking for more investment ideas beyond Apollo Global Management?
If Apollo Global Management has you thinking about your next move, do not stop here. Use the Simply Wall St screener tools to spot fresh opportunities before others.
- Target generous income streams by scanning for companies that feature 12 dividend fortresses and could strengthen the yield side of your portfolio.
- Prioritise resilience by focusing on businesses highlighted in the 78 resilient stocks with low risk scores so you are not caught off guard when conditions change.
- Hunt for future winners early by filtering through the screener containing 19 high quality undiscovered gems and see which lesser known stocks already show strong fundamentals.
This article by Simply Wall St is general in nature. We provide commentary based on historical data and analyst forecasts only using an unbiased methodology and our articles are not intended to be financial advice. It does not constitute a recommendation to buy or sell any stock, and does not take account of your objectives, or your financial situation. We aim to bring you long-term focused analysis driven by fundamental data. Note that our analysis may not factor in the latest price-sensitive company announcements or qualitative material. Simply Wall St has no position in any stocks mentioned.
Have feedback on this article? Concerned about the content? Get in touch with us directly. Alternatively, email editorial-team@simplywallst.com