
Terreno Realty (TRNO) Adds A Redmond Asset, Is The Stock Still Cheap?
Terreno Realty (TRNO) has added another industrial asset to its coastal portfolio, acquiring a vacant 21,000 square foot distribution building in Redmond, Washington for about US$8.0 million at an estimated stabilized cap rate of 5.9%.
See our latest analysis for Terreno Realty.
Terreno Realty's latest acquisitions in Redmond, Brooklyn and Torrance come as the stock trades at US$68.17, with a year to date share price return of 15.5% and a 1 year total shareholder return of 22.08%. This suggests positive longer term momentum despite some recent share price softness over the past month.
If you are comparing Terreno Realty with other real asset heavy businesses, it can be useful to widen your watchlist using a curated power grid and infrastructure screener such as 39 power grid technology and infrastructure stocks
After Terreno Realty’s latest industrial purchases and a share price near US$68, the decision for investors is simple but important. Is it better to step in at today’s level, or to hold out for a cheaper entry as the valuation section shows?
Preferred P/E of 19.2x for Terreno Realty: Is it justified?
On a simple earnings lens, Terreno Realty trades on a P/E of 19.2x, which screens as good value relative to several reference points even with the share price at $68.17.
The P/E ratio compares the current share price with earnings per share. For a real estate investment trust like Terreno Realty, it gives a quick sense of how much investors are paying for each dollar of earnings, which matters when the business is built around recurring rental income.
According to the data, Terreno Realty's 19.2x P/E is below the Industrial REITs industry average of 25.6x and also below the estimated fair P/E of 25.7x. The market is valuing each dollar of Terreno Realty earnings at a lower level than both the broader industrial REIT peer group and the fair ratio level that the regression model suggests the valuation could move toward if sentiment aligned with fundamentals.
Taken together, Terreno Realty is described as good value compared with the peer average P/E of 37.2x as well. That widens the gap between the current earnings multiple and the levels investors have been prepared to pay for similar companies.
Explore the SWS fair ratio for Terreno Realty
Result: Price-to-earnings of 19.2x (UNDERVALUED).
However, Terreno Realty still faces risks if annual net income growth remains negative or if the recent 6.7% share price pullback deepens and weighs on sentiment.
Find out about the key risks to this Terreno Realty narrative.
Another view on Terreno Realty using our DCF model
Terreno Realty looks inexpensive on a P/E of 19.2x, yet our DCF model paints a different picture. On that basis, the stock at $68.17 is trading above an estimated future cash flow value of $66.41, which points to a modest level of overvaluation. Which signal do you put more weight on?
Look into how the SWS DCF model arrives at its fair value.
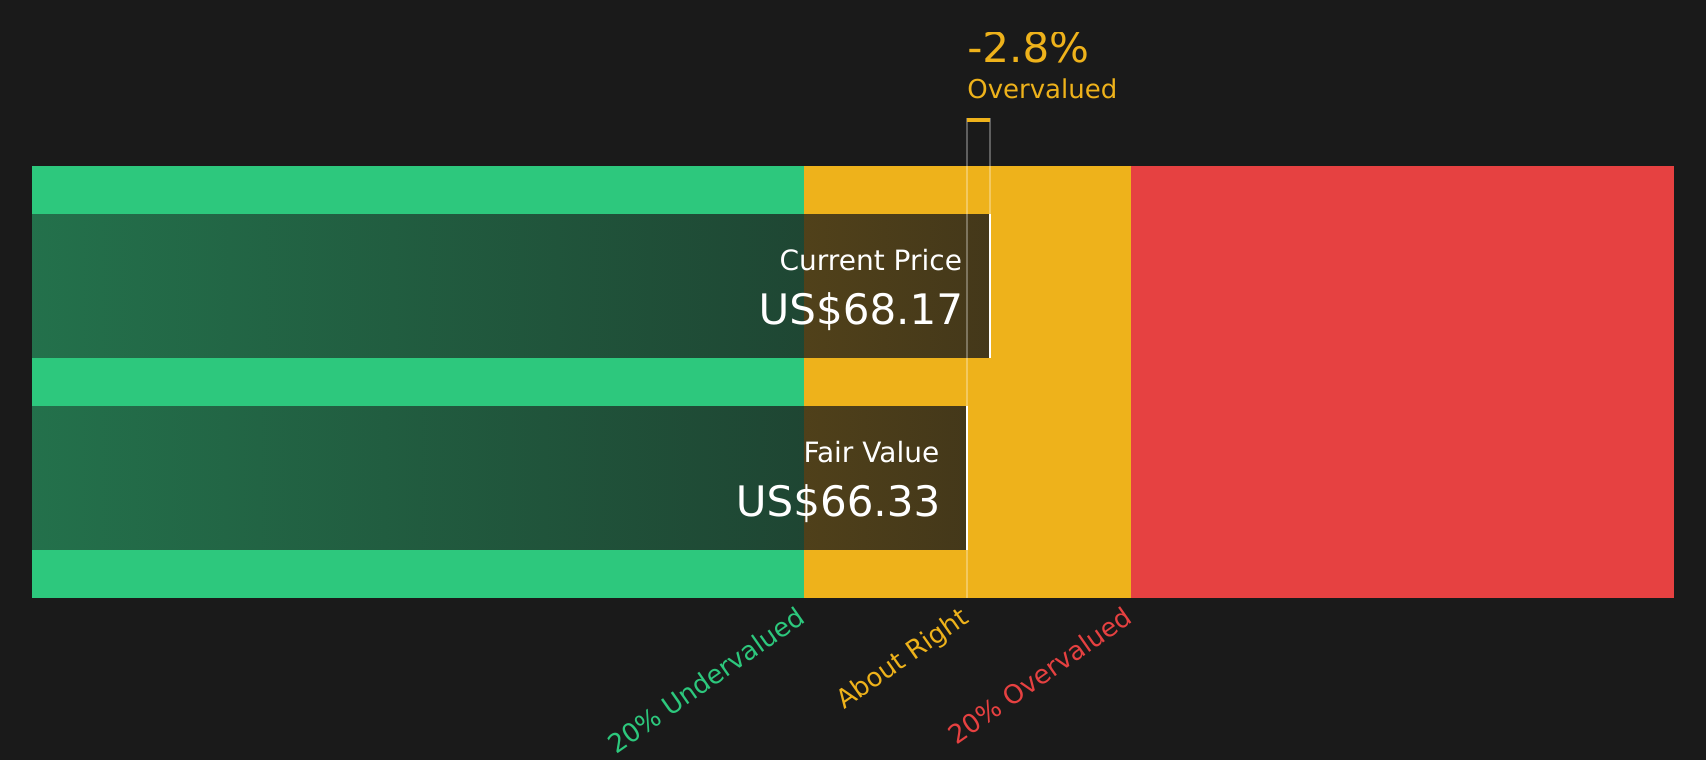
Simply Wall St performs a discounted cash flow (DCF) on every stock in the world every day (check out Terreno Realty for example). We show the entire calculation in full. You can track the result in your watchlist or portfolio and be alerted when this changes, or use our stock screener to discover 48 high quality undervalued stocks. If you save a screener we even alert you when new companies match - so you never miss a potential opportunity.
Next Steps
With Terreno Realty showing both potential rewards and clear risks, it makes sense to move quickly and review the numbers for yourself. To weigh the trade off between the upside drivers and the risk factors that other investors are watching, take a close look at the 3 key rewards and 3 important warning signs
Looking for more ideas beyond Terreno Realty?
If Terreno Realty has your attention, do not stop there. Broader ideas can help you balance risk, uncover different return drivers and avoid over relying on a single stock.
Use the Simply Wall St screener to move from watching to acting, and quickly find stocks that match what you care about most.
- Target potential mispricings by scanning 48 high quality undervalued stocks that combine attractive valuations with stronger fundamentals than the market might be pricing in.
- Strengthen your income stream by focusing on 12 dividend fortresses that aim to pair higher yields with more resilient payout profiles.
- Reduce portfolio stress by filtering for 78 resilient stocks with low risk scores so you stay anchored to companies with steadier financial and risk scores.
This article by Simply Wall St is general in nature. We provide commentary based on historical data and analyst forecasts only using an unbiased methodology and our articles are not intended to be financial advice. It does not constitute a recommendation to buy or sell any stock, and does not take account of your objectives, or your financial situation. We aim to bring you long-term focused analysis driven by fundamental data. Note that our analysis may not factor in the latest price-sensitive company announcements or qualitative material. Simply Wall St has no position in any stocks mentioned.
Have feedback on this article? Concerned about the content? Get in touch with us directly. Alternatively, email editorial-team@simplywallst.com