
St. Joe (JOE) Lands Anthropologie As Watersound Momentum Raises Valuation Questions
St. Joe (JOE) is back in focus after announcing that premium retailer Anthropologie has leased about 9,000 square feet at Watersound Town Center, alongside the opening of California inspired apparel brand Johnnie O.
See our latest analysis for St. Joe.
The Anthropologie lease and Johnnie O opening arrive as St. Joe trades at US$68.89, with a 30 day share price return of 11.44% and a 1 year total shareholder return of 35.48%, suggesting momentum has been building recently.
If this kind of retail led story has your attention, it can be useful to cast a wider net and see which other real estate focused companies are attracting premium tenants through the 21 top founder-led companies
For investors watching St. Joe after this recent run and new tenant interest, the real question is whether the current price already reflects that progress. Or if patience might offer a more attractive entry.
Price-to-Earnings of 31.9x: Is it justified for St. Joe?
On simple numbers, St. Joe trades on a P/E of 31.9x, which is rich compared with both the US Real Estate industry and its peer group averages.
The P/E ratio compares the current share price to the company’s earnings per share. For a real estate development and operating company like St. Joe, this figure often reflects what the market is willing to pay today for each dollar of current earnings, given its mix of residential, hospitality, and commercial activities.
With earnings growth of 48.7% over the past year and 10.2% per year over the past 5 years, the market may be pricing in the continuation of that profitability profile. Net profit margins of 22.5%, compared with 19.4% last year, and high quality earnings also point to a business where past profitability has been solid. The key question for investors is whether those earnings characteristics are durable enough to support a P/E at this level in the absence of clear forward forecasts.
Compared with the US Real Estate industry average P/E of 17.6x, St. Joe’s 31.9x is materially higher. It also exceeds the peer average of 26.5x, which suggests the stock currently carries a premium even versus similar companies. That premium may reflect its recent 1 year total shareholder return of 35.48% and earnings growth that surpassed the wider sector. However, it still leaves less room for disappointment if future results do not match what the market is implicitly expecting.
See what the numbers say about this price — find out in our valuation breakdown.
Result: Price-to-Earnings of 31.9x (OVERVALUED)
However, St. Joe’s premium P/E, reliance on real estate conditions, and the absence of analyst price targets all leave the current momentum narrative exposed to setbacks.
Find out about the key risks to this St. Joe narrative.
Another View on St. Joe's Value
The earlier focus on St. Joe’s 31.9x P/E points to an expensive stock on simple earnings terms. Yet the SWS DCF model presents a different perspective. At a share price of $68.89 versus an estimated future cash flow value of $152.97, the model suggests St. Joe appears materially undervalued on this basis.
This kind of gap can either signal a potential opportunity if those future cash flows are realistic, or indicate that the model assumptions are too generous. The key question for you is which interpretation seems more convincing when considered alongside your own expectations for the business and the real estate cycle over the next few years.
Look into how the SWS DCF model arrives at its fair value.
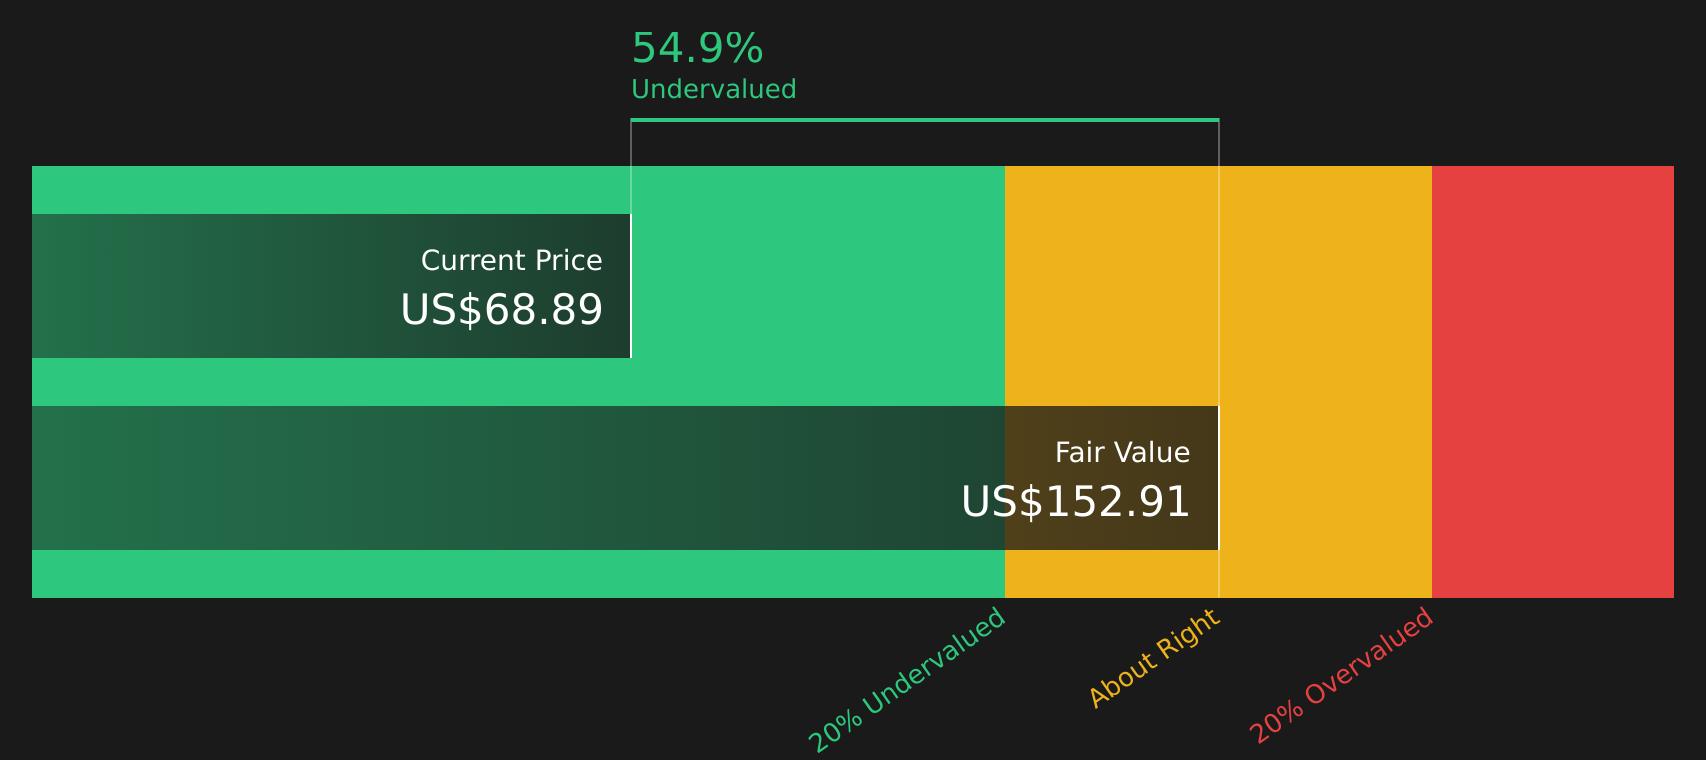
Simply Wall St performs a discounted cash flow (DCF) on every stock in the world every day (check out St. Joe for example). We show the entire calculation in full. You can track the result in your watchlist or portfolio and be alerted when this changes, or use our stock screener to discover 48 high quality undervalued stocks. If you save a screener we even alert you when new companies match - so you never miss a potential opportunity.
Next Steps
If the mix of enthusiasm and caution around St. Joe in this article feels familiar, it may be time to look at the data directly and decide how you view the balance of risks and rewards. To see both sides set out clearly, review the 2 key rewards and 1 important warning sign
Looking for more investment ideas beyond St. Joe?
If St. Joe has sharpened your focus, now is a good moment to broaden your watchlist using clear, data driven stock ideas from the Simply Wall St screener.
- Target dependable income by checking out companies that appear built for payouts through the 12 dividend fortresses.
- Spot potential value opportunities early by scanning the screener containing 19 high quality undiscovered gems before they gain wider attention.
- Prioritize resilience by reviewing companies in the 78 resilient stocks with low risk scores that score well on risk indicators.
This article by Simply Wall St is general in nature. We provide commentary based on historical data and analyst forecasts only using an unbiased methodology and our articles are not intended to be financial advice. It does not constitute a recommendation to buy or sell any stock, and does not take account of your objectives, or your financial situation. We aim to bring you long-term focused analysis driven by fundamental data. Note that our analysis may not factor in the latest price-sensitive company announcements or qualitative material. Simply Wall St has no position in any stocks mentioned.
Have feedback on this article? Concerned about the content? Get in touch with us directly. Alternatively, email editorial-team@simplywallst.com