
Brilliance China Automotive Holdings (SEHK:1114) Reports Mixed Interim Results, Is The Stock Cheap?
Why Brilliance China Automotive Holdings Stock Is In Focus After Interim Results
Brilliance China Automotive Holdings (SEHK:1114) has drawn fresh attention after reporting half year 2026 results. Sales reached CNY 675.77 million, while net income declined to CNY 778.5 million compared with the previous period.
See our latest analysis for Brilliance China Automotive Holdings.
Brilliance China Automotive Holdings shares last closed at HK$2.405, with a 1 month share price return of 20.25% and a 7 day share price return of 10.07%, although the year to date share price return is down 40.91% and the 1 year total shareholder return is down 15.87%. This is set against a very large 3 year total shareholder return that signals earlier strong performance and some recent loss of momentum.
If the latest interim results have you reassessing the sector, it can help to look across other opportunities in the market, including companies highlighted in our 112 top founder-led companies
After the sharp recent move in Brilliance China Automotive Holdings shares and the wide gap between the current price of HK$2.405 and published fair value estimates, investors may be asking where a reasonable valuation range actually falls for this stock now.
Preferred Price-to-Earnings of 5.2x: Is It Justified For Brilliance China Automotive Holdings?
On simple earnings metrics, Brilliance China Automotive Holdings looks inexpensive, with the shares at HK$2.405 trading on a P/E of 5.2x that sits well below peers and the broader Hong Kong market.
The P/E ratio compares the HK$2.405 share price with the company’s earnings per share. For an auto manufacturer and components group like Brilliance China Automotive Holdings, it gives a quick sense of how much investors are paying for each unit of current earnings.
Here, the 5.2x P/E is described as good value relative to both the Asian auto industry average of 13.3x and a peer average of 30x. It is also below the estimated fair P/E of 7.2x and below the wider Hong Kong market at 11.6x. That indicates the market is valuing the stock at a discount to what earnings and the fair ratio model might support, and it leaves scope for the valuation multiple to move closer to those reference points if sentiment or fundamentals change.
Explore the SWS fair ratio for Brilliance China Automotive Holdings
Result: Price-to-earnings of 5.2x (UNDERVALUED)
However, investors in Brilliance China Automotive Holdings still need to weigh flat net income growth and the revenue concentration in the PRC as possible pressure points.
Find out about the key risks to this Brilliance China Automotive Holdings narrative.
Another View On Brilliance China Automotive Holdings Using DCF
The earnings based P/E picture for Brilliance China Automotive Holdings looks supportive, yet the SWS DCF model points in the opposite direction. With the share price around HK$2.41 and the model indicating HK$1.84 for future cash flow value, the stock comes out as overvalued on this approach. Which lens do you trust more when cash flows and earnings disagree?
For a closer look at how this cash flow view is built, including the key assumptions that sit behind it, have a read of the Look into how the SWS DCF model arrives at its fair value.
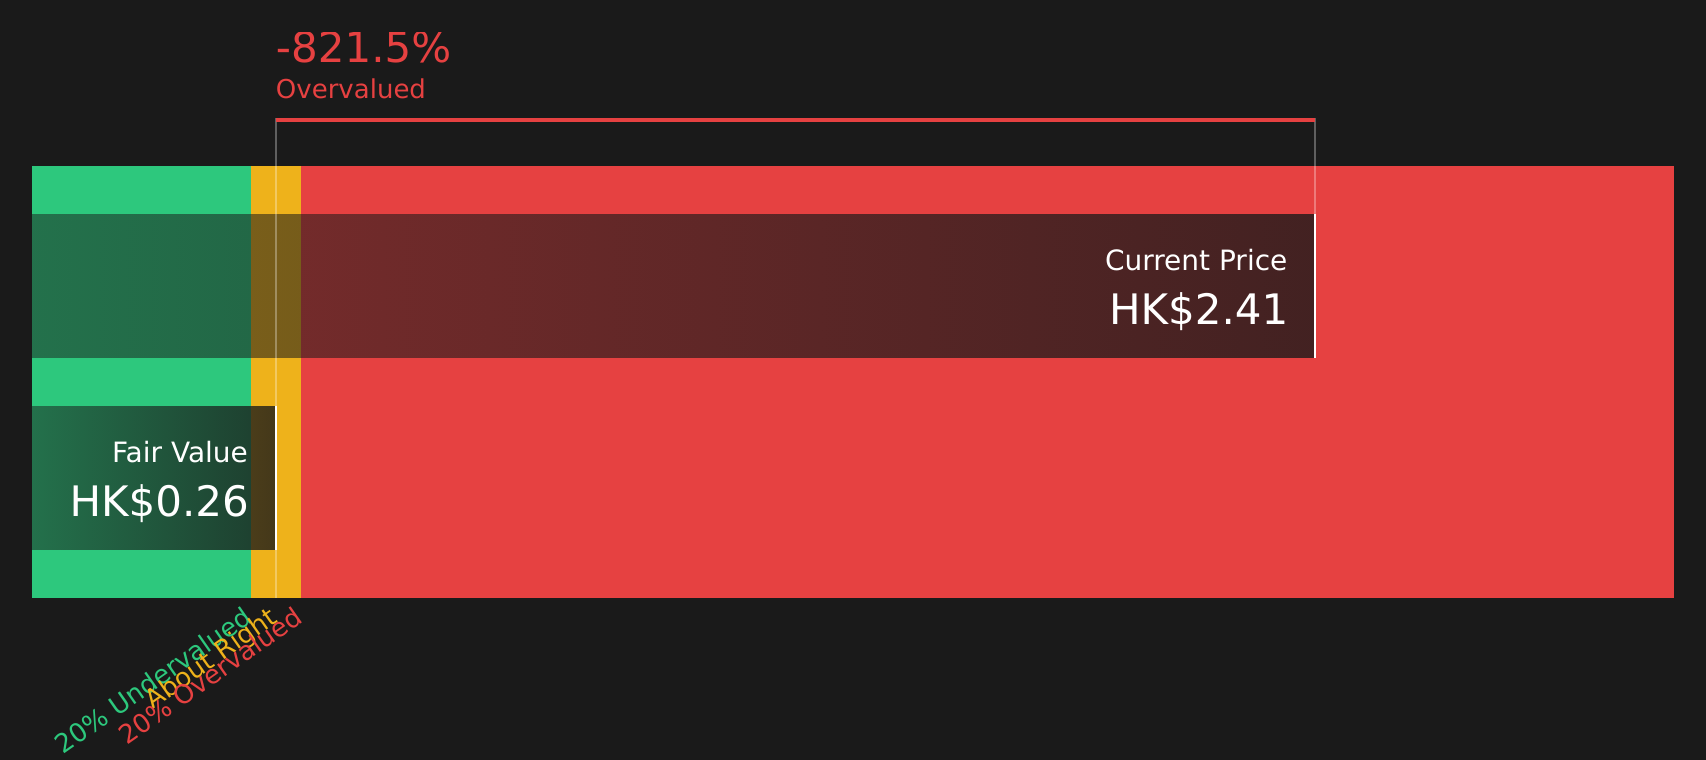
Simply Wall St performs a discounted cash flow (DCF) on every stock in the world every day (check out Brilliance China Automotive Holdings for example). We show the entire calculation in full. You can track the result in your watchlist or portfolio and be alerted when this changes, or use our stock screener to discover 269 high quality undervalued stocks. If you save a screener we even alert you when new companies match - so you never miss a potential opportunity.
Next Steps
The mix of signals around Brilliance China Automotive Holdings makes this a stock where your own judgment really matters, so move quickly to review the full picture and weigh both the potential and the pressure points by going through the 2 key rewards and 3 important warning signs
Looking For More Investment Ideas Beyond Brilliance China Automotive Holdings?
If you are reassessing Brilliance China Automotive Holdings, do not stop here. Use focused stock lists to spot fresh ideas that fit your goals before the market does.
- Zero in on potential mispricing opportunities by reviewing screener containing 614 high quality undiscovered gems that combine solid fundamentals with lower market attention.
- Lock in ideas with sturdier financial footing by scanning the solid balance sheet and fundamentals stocks screener (425 results) that prioritises resilience and balance sheet strength.
- Target income focused opportunities through the 424 dividend fortresses that highlights companies offering higher yields with an emphasis on durability.
This article by Simply Wall St is general in nature. We provide commentary based on historical data and analyst forecasts only using an unbiased methodology and our articles are not intended to be financial advice. It does not constitute a recommendation to buy or sell any stock, and does not take account of your objectives, or your financial situation. We aim to bring you long-term focused analysis driven by fundamental data. Note that our analysis may not factor in the latest price-sensitive company announcements or qualitative material. Simply Wall St has no position in any stocks mentioned.
Have feedback on this article? Concerned about the content? Get in touch with us directly. Alternatively, email editorial-team@simplywallst.com