
Precision Tsugami China (SEHK:1651) Could Be 53% Undervalued Following AGM Dividend Declaration
Precision Tsugami (China) (SEHK:1651) caught investor attention after its 17 August 2026 AGM, where the company declared a final dividend of HK$0.90 per share and approved a new memorandum and articles of association.
See our latest analysis for Precision Tsugami (China).
Those AGM decisions come after a sharp pullback in recent weeks, with the share price down 10.1% over 30 days and 13.5% over 90 days, yet still supported by a 51.6% year to date share price return and a very large 3 year total shareholder return of around 7x. This suggests investors are reassessing both growth potential and risk around Precision Tsugami (China).
If the dividend news has you thinking more broadly about income and growth ideas, it can be useful to also look at companies exposed to robotics and automation trends through the 37 robotics and automation stocks
After such a strong three year run and a recent pullback around the AGM dividend news, the question for Precision Tsugami (China) is whether the current valuation still offers an attractive balance of risk and reward.
Price-to-Earnings of 15.1x for Precision Tsugami (China): Is it justified?
On simple multiples, Precision Tsugami (China) trades on a P/E of 15.1x, which screens as expensive compared to both peers and an internal fair value estimate.
The P/E ratio compares the HK$52.3 share price to the company’s earnings per share and reflects what investors are currently willing to pay for each dollar of earnings. For a machinery manufacturer with established profitability, this often captures how the market weighs its growth profile and earnings quality.
Several checks point to a rich valuation on this measure. The stock is described as expensive on a P/E basis versus its own estimated fair P/E of 13x, the Hong Kong Machinery industry average of 12.6x, and a narrower peer average of 14.1x. Those gaps indicate investors are assigning a premium to Precision Tsugami (China) that the market could reassess if expectations change or drift back toward that fair P/E level over time.
Against this backdrop, the P/E looks high in absolute terms and relative to sector benchmarks, even though the company also screens as trading below an internal fair value estimate based on cash flows. Investors weighing the trade off between quality, growth and price may want to understand how that fair ratio was derived and what would need to change for the current multiple to look more reasonable.
Explore the SWS fair ratio for Precision Tsugami (China)
Result: Price-to-Earnings of 15.1x (OVERVALUED)
However, Precision Tsugami (China) still faces risks if demand for CNC tools in Mainland China cools or if investors lose confidence in its current earnings quality.
Find out about the key risks to this Precision Tsugami (China) narrative.
Another view on Precision Tsugami (China)'s valuation
While the current P/E of 15.1x suggests Precision Tsugami (China) looks expensive on earnings, the SWS DCF model points in the opposite direction. It indicates the HK$52.3 share price is trading well below an estimated fair value of HK$111.01, which is flagged as undervalued.
That gap highlights how different models can tell very different stories about the same stock. It raises a simple question for investors: Which set of assumptions feels more realistic for Precision Tsugami (China) over the long term?
Look into how the SWS DCF model arrives at its fair value.
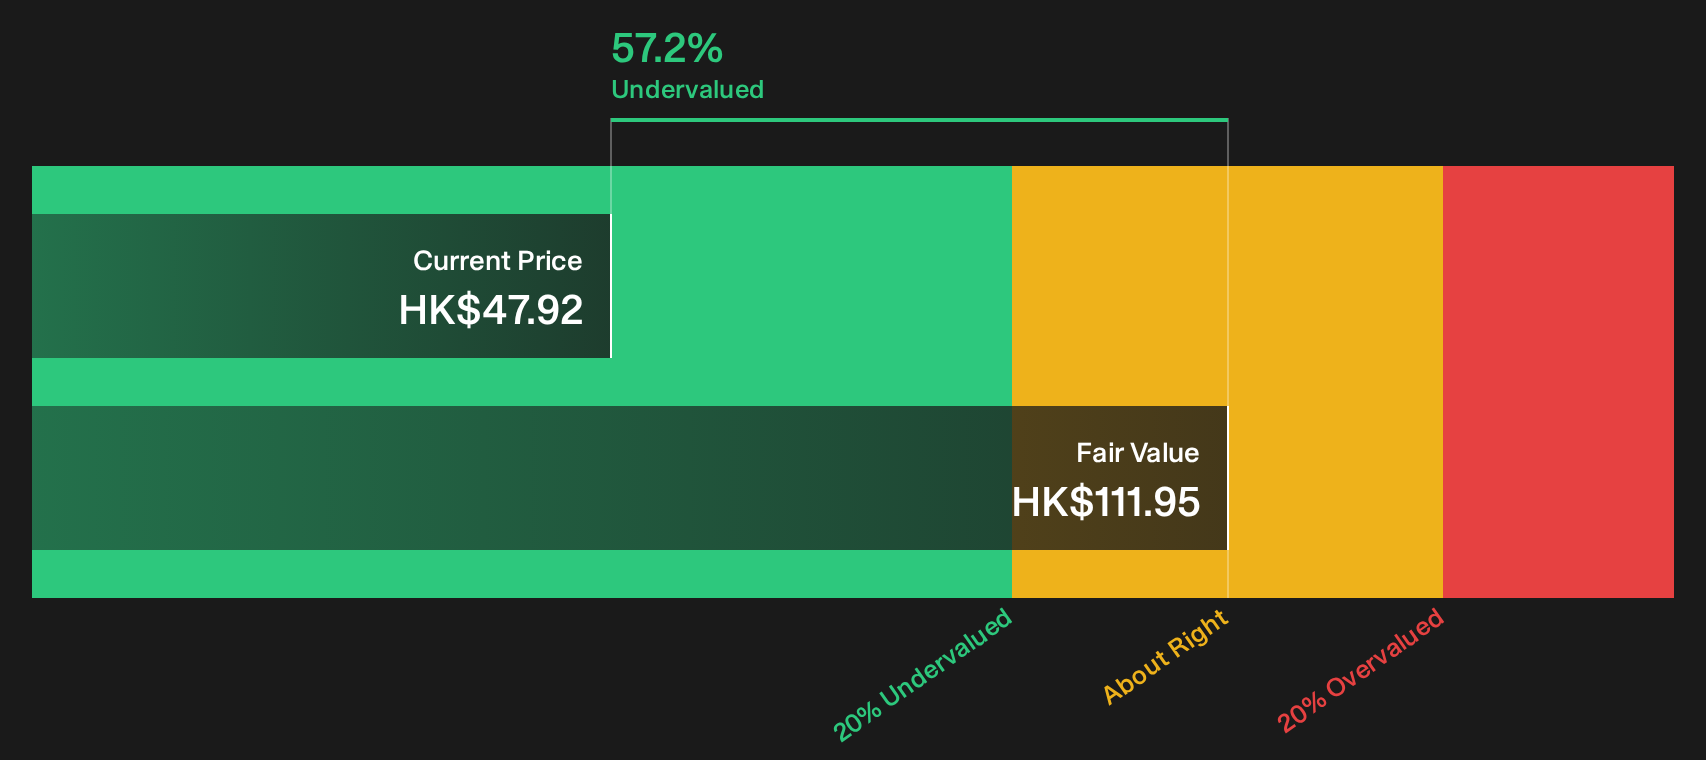
Simply Wall St performs a discounted cash flow (DCF) on every stock in the world every day (check out Precision Tsugami (China) for example). We show the entire calculation in full. You can track the result in your watchlist or portfolio and be alerted when this changes, or use our stock screener to discover 267 high quality undervalued stocks. If you save a screener we even alert you when new companies match - so you never miss a potential opportunity.
Next Steps
Given the mix of positives and concerns around Precision Tsugami (China), it makes sense to move quickly, review the key data, and form your own view with the help of 3 key rewards and 1 important warning sign
Looking for more investment ideas beyond Precision Tsugami (China)?
Precision Tsugami (China) might already be on your watchlist, but the real edge often comes from comparing it with other strong opportunities across different styles and risk levels.
- Target dependable cash generators and compare their appeal to Precision Tsugami (China) using the 267 high quality undervalued stocks.
- Strengthen the defensive side of your portfolio by reviewing companies that show resilient balance sheets through the solid balance sheet and fundamentals stocks screener (427 results).
- Stay ahead of the crowd by scanning for underfollowed opportunities via the screener containing 608 high quality undiscovered gems.
This article by Simply Wall St is general in nature. We provide commentary based on historical data and analyst forecasts only using an unbiased methodology and our articles are not intended to be financial advice. It does not constitute a recommendation to buy or sell any stock, and does not take account of your objectives, or your financial situation. We aim to bring you long-term focused analysis driven by fundamental data. Note that our analysis may not factor in the latest price-sensitive company announcements or qualitative material. Simply Wall St has no position in any stocks mentioned.
Have feedback on this article? Concerned about the content? Get in touch with us directly. Alternatively, email editorial-team@simplywallst.com