
Is Union Pacific (UNP) A Bargain Following Its Run To $308.05?
Union Pacific (UNP) has drawn investor attention after recent share price moves, with the stock closing at US$308.05 on 19 August 2026. This puts the company’s market value at about US$183b.
See our latest analysis for Union Pacific.
For context, Union Pacific’s recent share price strength has been meaningful, with a 1 day share price return of 1.34% and a year to date share price return of 32.83%. The 1 year total shareholder return is 41.07%, which suggests momentum has been building rather than fading.
If Union Pacific’s recent gains have you thinking about other opportunities tied to large scale infrastructure and freight, this is a good moment to scan 39 power grid technology and infrastructure stocks
After Union Pacific’s strong run and the stock at US$308.05, the gap between today’s price, analyst targets and intrinsic value estimates has widened. So where does fair value really land for this railroad heavyweight?
Most Popular Narrative: 6% Undervalued
On the most followed narrative, Union Pacific’s fair value sits at $327.75 against the latest close of $308.05. This frames the current move as a modest discount rather than a stretched valuation.
Union Pacific is implementing multiple efficiency enhancements, such as energy management systems for locomotives and optimization tools, which are expected to improve operational efficiency and net margins. The company is expanding capacity with new infrastructure, such as facilities in Houston and Phoenix, which could support future growth and positively impact revenue.
It is worth considering what kind of earnings power those efficiency gains and new facilities are designed to support. The narrative leans on rising margins and a richer future earnings multiple to justify that fair value. The full story spells out how revenue, profitability and the assumed discount rate are connected to reach $327.75.
Result: Fair Value of $327.75 (UNDERVALUED)
Have a read of the narrative in full and understand what's behind the forecasts.
However, you also need to factor in risks such as shifting trade policies and tougher trucking competition, which could put pressure on Union Pacific’s volumes and pricing power.
Find out about the key risks to this Union Pacific narrative.
Another View on Union Pacific’s Valuation
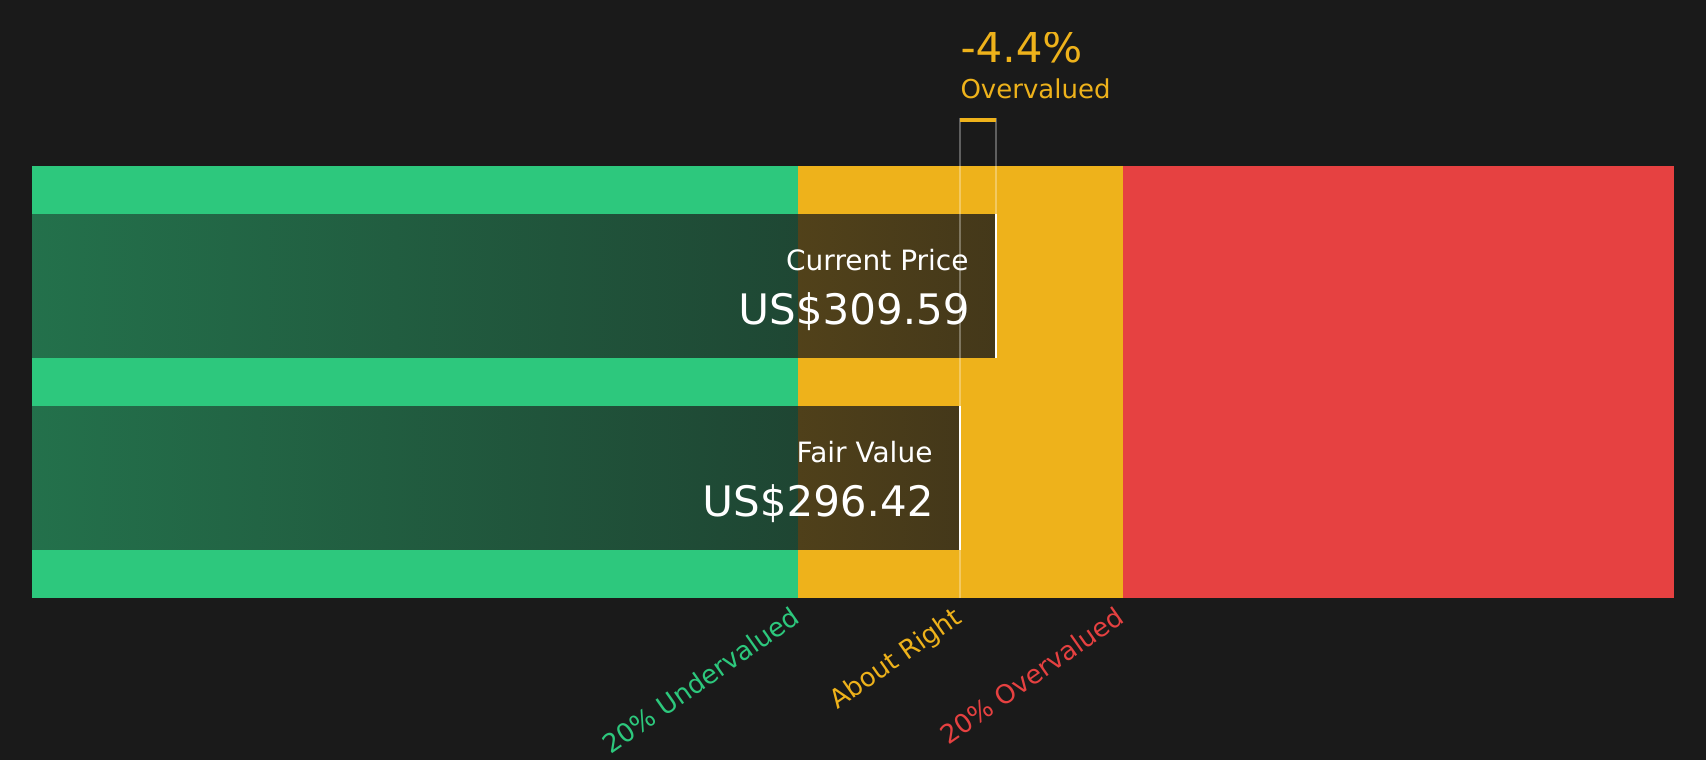
While the leading Union Pacific narrative frames the stock as about 6% undervalued at $308.05 versus a $327.75 fair value, the SWS DCF model tells a more cautious story. On that math, Union Pacific’s current price sits above an estimated $295.93 future cash flow value, which points to mild overvaluation instead.
That split between what earnings based narratives suggest and what the cash flow model implies raises an important question for you. Which set of trade offs around growth, margins and discount rates feels more realistic for Union Pacific over the next few years, and how much room for error are you comfortable with in today’s price?
Look into how the SWS DCF model arrives at its fair value.
Simply Wall St performs a discounted cash flow (DCF) on every stock in the world every day (check out Union Pacific for example). We show the entire calculation in full. You can track the result in your watchlist or portfolio and be alerted when this changes, or use our stock screener to discover 48 high quality undervalued stocks. If you save a screener we even alert you when new companies match - so you never miss a potential opportunity.
Next Steps
With Union Pacific carrying both optimism around rewards and caution around risks, it makes sense to move quickly and weigh the trade offs for yourself. To see both sides clearly and pressure test your own view, start with the 5 key rewards and 1 important warning sign
Looking for more investment ideas beyond Union Pacific?
If Union Pacific has sharpened your interest, do not stop here. Use the Simply Wall St screener to uncover fresh stock ideas that fit your style.
- Target yield potential with companies that prioritise cash returns to shareholders through 12 dividend fortresses.
- Spot opportunities where quality and valuation line up by running 48 high quality undervalued stocks.
- Focus on resilience and sleep a little easier by checking 75 resilient stocks with low risk scores.
This article by Simply Wall St is general in nature. We provide commentary based on historical data and analyst forecasts only using an unbiased methodology and our articles are not intended to be financial advice. It does not constitute a recommendation to buy or sell any stock, and does not take account of your objectives, or your financial situation. We aim to bring you long-term focused analysis driven by fundamental data. Note that our analysis may not factor in the latest price-sensitive company announcements or qualitative material. Simply Wall St has no position in any stocks mentioned.
Have feedback on this article? Concerned about the content? Get in touch with us directly. Alternatively, email editorial-team@simplywallst.com