
How JEOL’s Sharp Q1 2026 Revenue Drop And Swing To Loss At JEOL (TSE:6951) Has Changed Its Investment Story
- JEOL Ltd. recently reported first-quarter 2026 results, with sales falling to ¥24,465 million from ¥40,145 million a year earlier and swinging from a ¥4,669 million net profit to a ¥1,710 million net loss.
- The quarter also saw a sharp reversal in per-share performance, with basic earnings of ¥91.32 turning into a basic loss of ¥35.12 from continuing operations.
- We will now examine how this sharp revenue contraction and move to a quarterly loss could influence JEOL’s broader investment narrative.
Explore 24 top quantum computing companies leading the revolution in next-gen technology and shaping the future with breakthroughs in quantum algorithms, superconducting qubits, and cutting-edge research.
What Is JEOL's Investment Narrative?
To own JEOL today, you need to be comfortable backing a precision-instrument business that leans heavily on product innovation, disciplined capital returns and a still-supportive earnings outlook, despite clear bumps in the road. The Q1 FY2027 miss, with sales down sharply and a swing to loss, now sits awkwardly beside management’s earlier guidance for profit growth and the recent dividend uplift, putting greater focus on how quickly orders and margins can stabilise. In the near term, the key catalysts remain uptake of new platforms like LazEdge, progress on the Sysmex-linked medical divestiture and evidence that the order book can support the company’s profit targets. The quarter’s setback raises execution and demand-risk concerns rather than completely rewriting the story, but it does make the next couple of results much more important. Yet one area of risk, linked to that guidance-versus-reality gap, deserves closer attention.
JEOL's share price has been on the slide but might be dropping deeper into value territory. Find out whether it's a bargain at this price.Exploring Other Perspectives
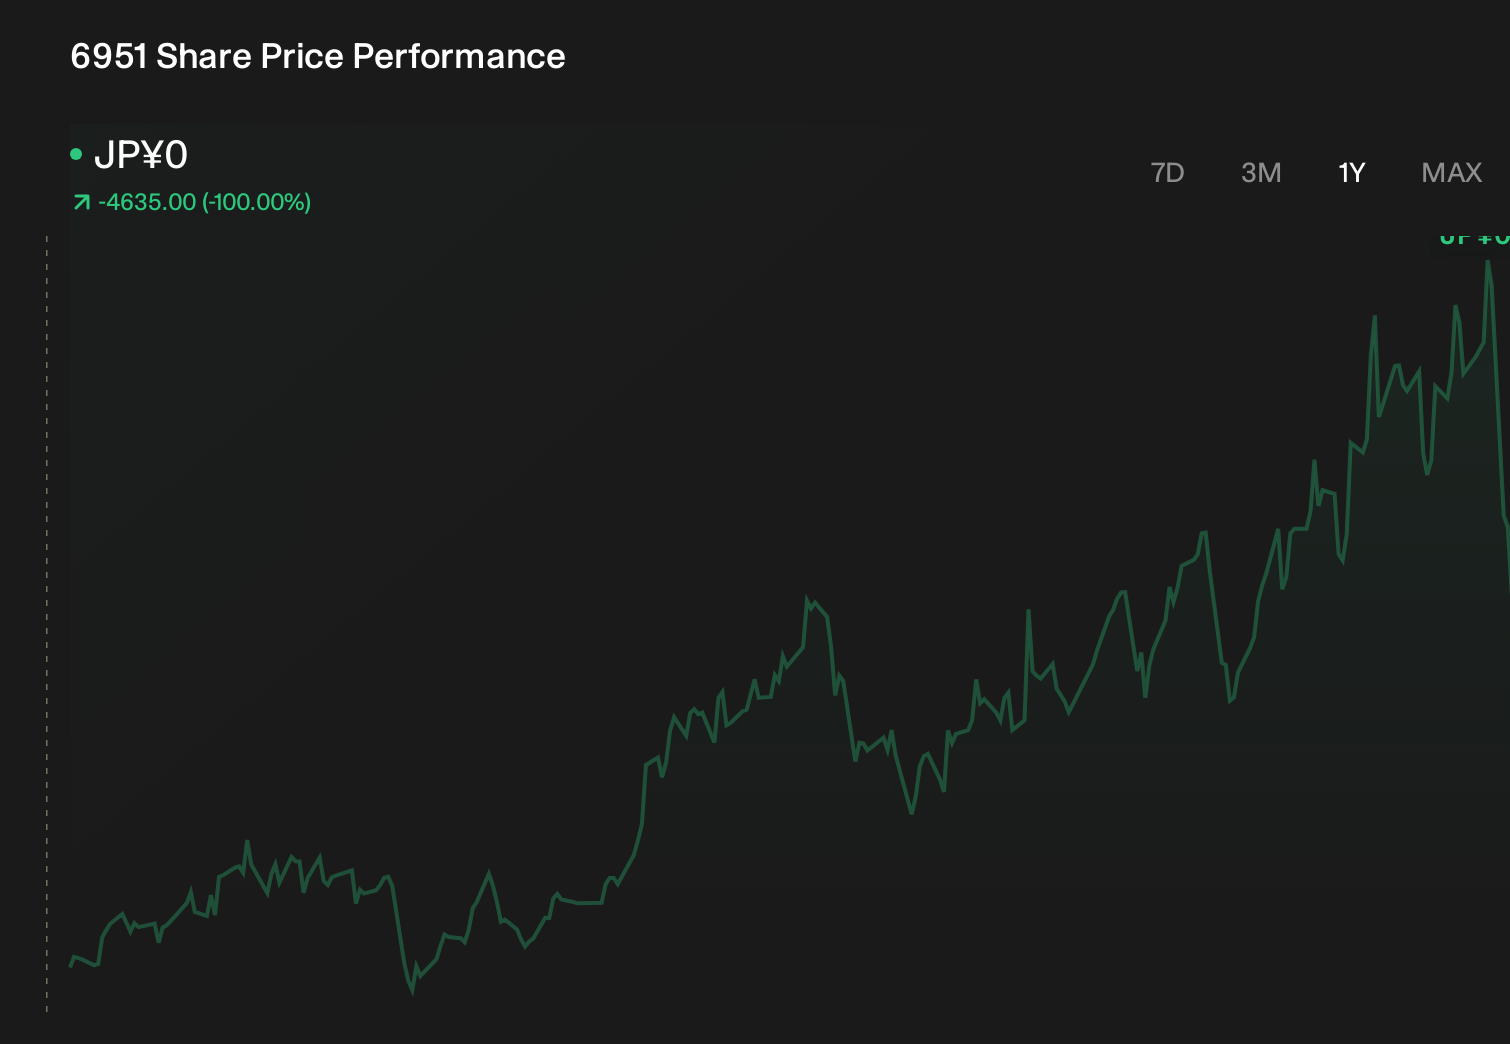
Explore another fair value estimate on JEOL - why the stock might be worth as much as 22% more than the current price!
The Verdict Is Yours
Don't just follow the ticker - dig into the data and build a conviction that's truly your own.
- A great starting point for your JEOL research is our analysis highlighting 1 key reward and 2 important warning signs that could impact your investment decision.
- Our free JEOL research report provides a comprehensive fundamental analysis summarized in a single visual - the Snowflake - making it easy to evaluate JEOL's overall financial health at a glance.
No Opportunity In JEOL?
Early movers are already taking notice. See the stocks they're targeting before they've flown the coop:
- AI is about to change healthcare. These 8 stocks are working on everything from early diagnostics to drug discovery. The best part - they are all under $10b in market cap - there's still time to get in early.
- The best AI stocks today may lie beyond giants like Nvidia and Microsoft. Find the next big opportunity with these 18 smaller AI-focused companies with strong growth potential through early-stage innovation in machine learning, automation, and data intelligence that could fund your retirement.
- Invest in the nuclear renaissance through our list of 92 elite nuclear energy infrastructure plays powering the global AI revolution.
This article by Simply Wall St is general in nature. We provide commentary based on historical data and analyst forecasts only using an unbiased methodology and our articles are not intended to be financial advice. It does not constitute a recommendation to buy or sell any stock, and does not take account of your objectives, or your financial situation. We aim to bring you long-term focused analysis driven by fundamental data. Note that our analysis may not factor in the latest price-sensitive company announcements or qualitative material. Simply Wall St has no position in any stocks mentioned.
Have feedback on this article? Concerned about the content? Get in touch with us directly. Alternatively, email editorial-team@simplywallst.com