
Is NSD (TSE:9759) Undervalued After Its July Sales Update?
NSD stock reacts to preliminary July sales update
NSD (TSE:9759) drew fresh attention after reporting preliminary unaudited consolidated net sales of ¥10,585 million for July 2026 and ¥40,515 million for the year to date, both above the prior year figures.
See our latest analysis for NSD.
The preliminary sales update comes after a mixed run for NSD’s stock, with a 90 day share price return of 13.57% and a year to date share price decline of 15.13%. The 5 year total shareholder return of 62.17% highlights how sentiment has varied over different holding periods.
If you are considering how this sales news fits into the wider technology sector, it can be helpful to scan other listed peers through a focused screener such as 54 AI infrastructure stocks
After July’s sales update and the recent rebound in NSD’s share price, the key issue now is whether the current valuation still leaves enough upside to compensate for the risks you are taking on.
Price-to-earnings of 16.4x for NSD: Is it justified?
On the latest data, NSD trades on a P/E of 16.4x, which screens as good value compared to its own fair ratio estimate and to several reference points in the IT sector.
The P/E multiple compares the current share price to earnings per share and is a common way investors weigh how much they are paying for a company’s current earnings. For a business like NSD, which is active across finance, manufacturing, telecoms and other industries, this helps you judge what the market is currently willing to pay for its profit stream.
According to the checks provided, NSD’s 16.4x P/E is below the estimated fair P/E of 18.6x. It is also below the peer average P/E of 23.9x and slightly below the broader JP IT industry average P/E of 16.7x. That combination suggests the current market price is assigning a lower earnings multiple than the level the fair ratio work indicates the stock could move toward.
Relative to both peers and the wider IT industry, NSD’s valuation therefore looks restrained rather than stretched based on earnings.
Explore the SWS fair ratio for NSD
Result: Price-to-earnings of 16.4x (UNDERVALUED)
However, there are still clear risks for NSD, including any slowdown in client IT spending or pressure on margins across its system development and infrastructure businesses.
Find out about the key risks to this NSD narrative.
Another view on NSD’s valuation
The earlier check used NSD’s 16.4x P/E against its fair ratio and sector averages. A second approach uses our DCF model, which estimates a fair value of ¥3,597.7 per share. With the stock at ¥2,886.5, this indicates that it is trading below that estimate and appears undervalued.
That gap can signal either an opportunity if the cash flow assumptions hold up, or a warning if the market is pricing in different risks. The key question is which story you think is closer to reality for NSD.
Look into how the SWS DCF model arrives at its fair value.
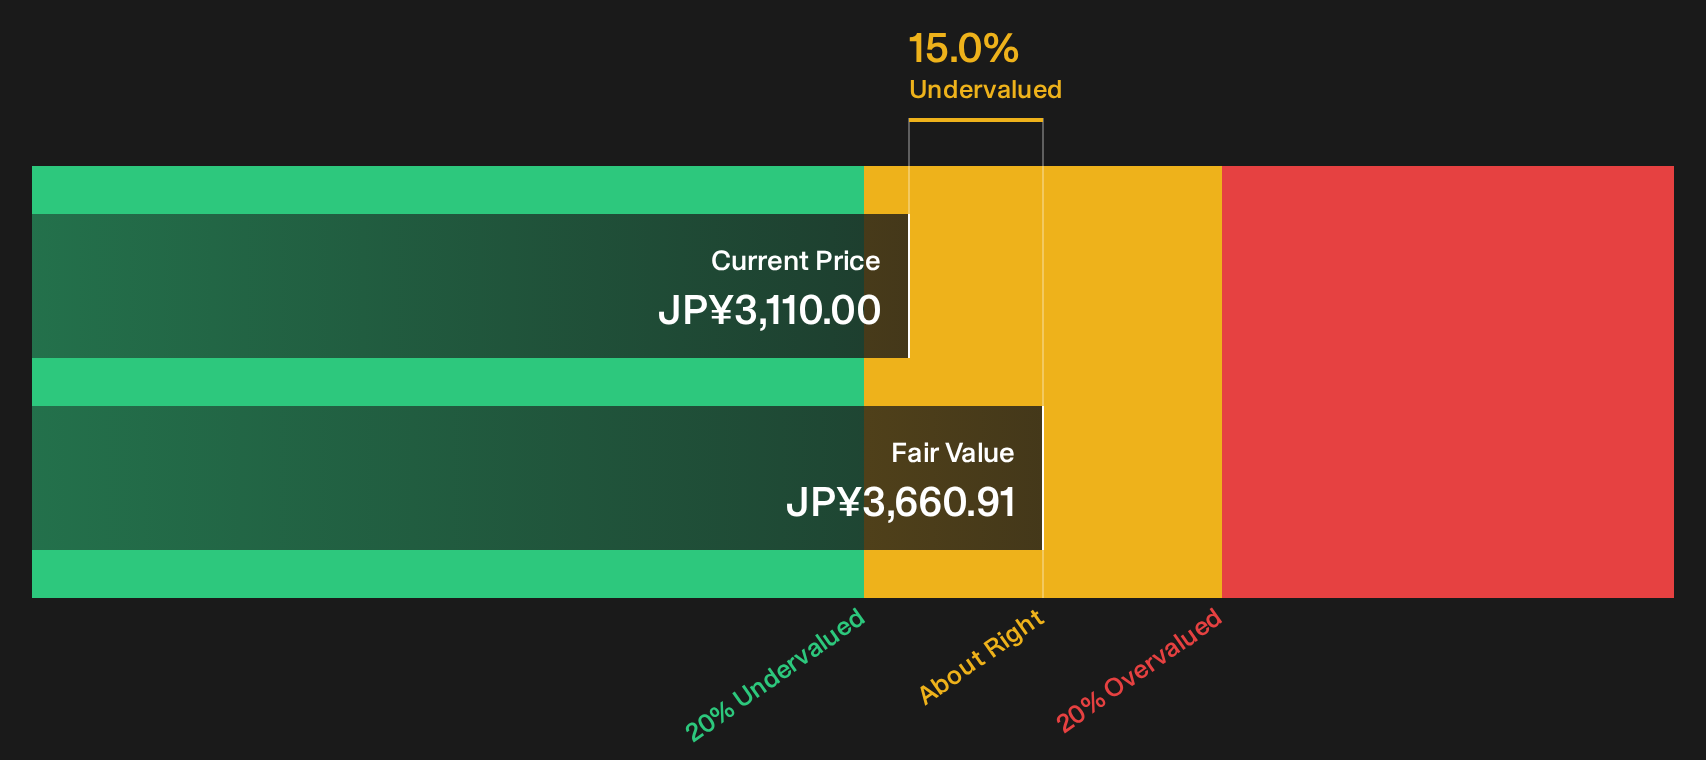
Simply Wall St performs a discounted cash flow (DCF) on every stock in the world every day (check out NSD for example). We show the entire calculation in full. You can track the result in your watchlist or portfolio and be alerted when this changes, or use our stock screener to discover 25 high quality undervalued stocks. If you save a screener we even alert you when new companies match - so you never miss a potential opportunity.
Next Steps
With sentiment on NSD looking cautiously optimistic, this is a good moment to act quickly and review the data for yourself. Take a closer look at the 5 key rewards
Looking for more investment ideas beyond NSD?
If NSD has you thinking more broadly about opportunities, do not stop here. Use the Simply Wall St screener to compare other ideas and pressure test your portfolio.
- Target potential bargains by reviewing companies that look mispriced compared to their fundamentals through the 25 high quality undervalued stocks.
- Strengthen your focus on resilience by scanning stocks with robust finances using the solid balance sheet and fundamentals stocks screener (41 results).
- Spot opportunities others may be overlooking by checking the screener containing 74 high quality undiscovered gems before attention shifts and valuations adjust.
This article by Simply Wall St is general in nature. We provide commentary based on historical data and analyst forecasts only using an unbiased methodology and our articles are not intended to be financial advice. It does not constitute a recommendation to buy or sell any stock, and does not take account of your objectives, or your financial situation. We aim to bring you long-term focused analysis driven by fundamental data. Note that our analysis may not factor in the latest price-sensitive company announcements or qualitative material. Simply Wall St has no position in any stocks mentioned.
Have feedback on this article? Concerned about the content? Get in touch with us directly. Alternatively, email editorial-team@simplywallst.com