
Kadokawa (TSE:9468) Shares Just Moved, So What Is Going On?
What the latest earnings and guidance mean for Kadokawa stock
Kadokawa (TSE:9468) reported first quarter results on 13 August 2026 that included a net loss driven by an extraordinary charge from a special early retirement program, and the company also lowered full year earnings guidance.
See our latest analysis for Kadokawa.
The net loss and lowered guidance appear to have tempered enthusiasm, yet Kadokawa’s share price return of 16.35% year to date and 14.48% over 90 days suggests momentum has been building. At the same time, the 5.01% one year total shareholder return points to a more modest longer term outcome.
If you are reassessing your exposure to media and entertainment, this can be a useful moment to look beyond a single stock and scan other opportunities through 13 top founder-led companies
After a year of only modest total returns but a sharp move in recent months, Kadokawa now poses a practical question: Do you commit at today’s price, or wait in case the post earnings reset offers a cheaper entry ahead?
Preferred Price-to-Sales multiple of 1.9x for Kadokawa, is it justified?
Kadokawa last closed at ¥3,637 and is assessed as expensive on a P/S multiple of 1.9x compared with both peers and the wider JP Media industry.
The P/S ratio compares a company’s market value with its revenue. For a diversified media and entertainment group like Kadokawa, it is often used when earnings are volatile or currently loss making, as it benchmarks what investors are paying for each unit of sales.
According to the data, Kadokawa trades on a P/S of 1.9x while the peer average is 1.4x and the JP Media industry average is 0.9x. That points to investors paying a clear premium to sector norms. At the same time, the estimated fair P/S ratio for Kadokawa is 2.0x, which is slightly above the current 1.9x level and represents a mark that market pricing could move towards if those fair value assumptions prove accurate.
Explore the SWS fair ratio for Kadokawa
Result: Price-to-sales of 1.9x (OVERVALUED).
However, Kadokawa’s recent net loss and the discount to the analyst price target could both challenge the current premium P/S rating if sentiment shifts.
Find out about the key risks to this Kadokawa narrative.
Another view on Kadokawa’s value
While Kadokawa screens as expensive on a 1.9x P/S against the 1.4x peer average and 0.9x JP Media industry level, the SWS DCF model comes out even more cautious. At ¥3,637 the share price sits well above an estimated future cash flow value of ¥1,852.06, which flags a different kind of pricing risk. Which signal do you treat as more important right now?
Look into how the SWS DCF model arrives at its fair value.
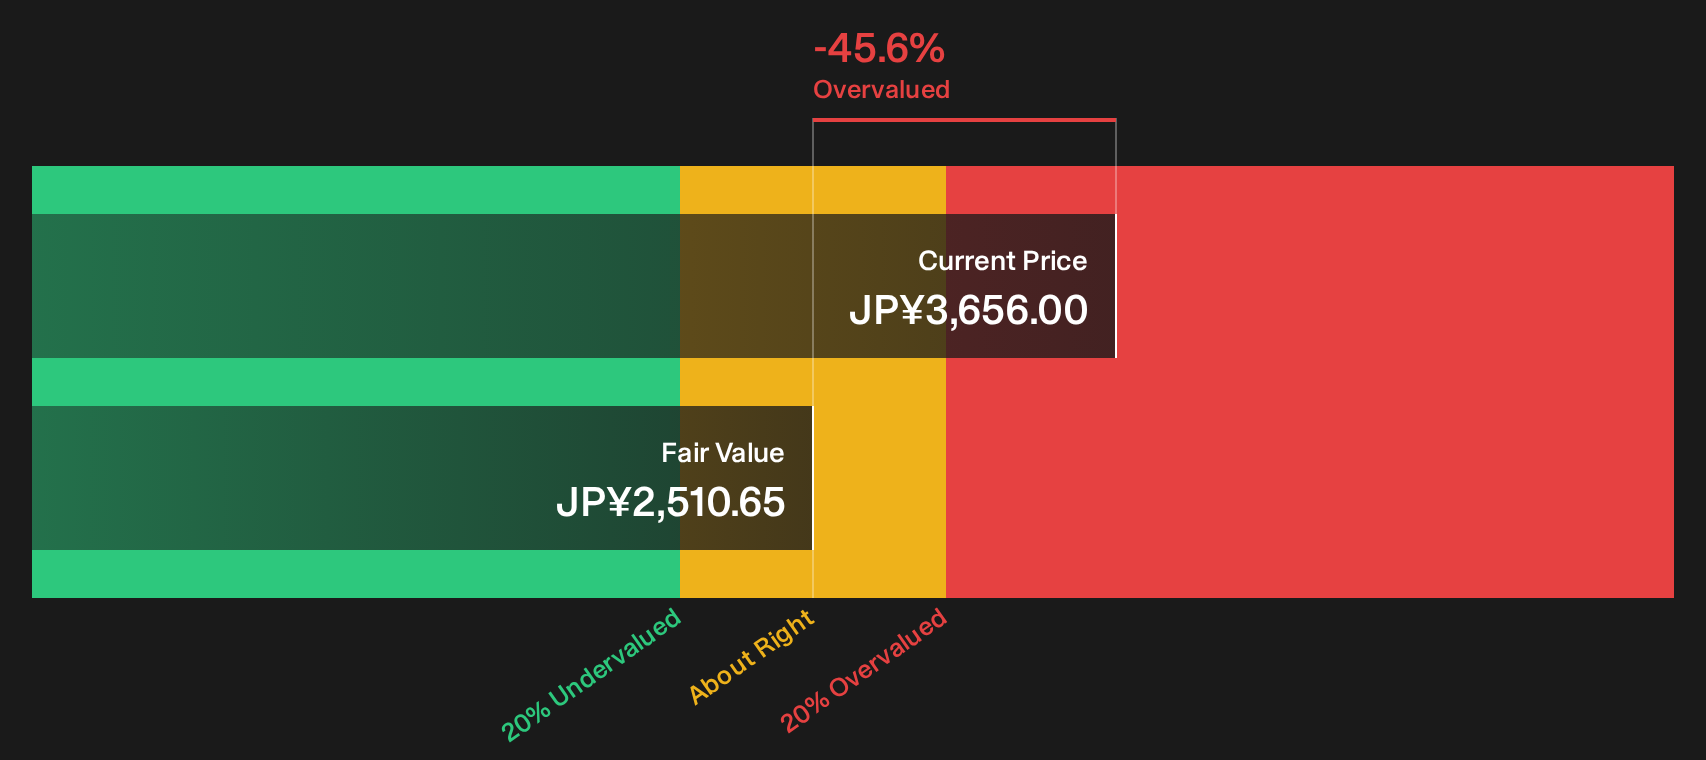
Simply Wall St performs a discounted cash flow (DCF) on every stock in the world every day (check out Kadokawa for example). We show the entire calculation in full. You can track the result in your watchlist or portfolio and be alerted when this changes, or use our stock screener to discover 25 high quality undervalued stocks. If you save a screener we even alert you when new companies match - so you never miss a potential opportunity.
Next Steps
If the mixed tone on Kadokawa so far leaves you undecided, take a closer look at the underlying data and move quickly to form your own view. To see what the optimism is based on, review the 1 key reward
Looking for more Kadokawa style investment ideas?
If Kadokawa has you rethinking where to put fresh capital, use this moment to widen your search and build a stronger watchlist before making your next move.
- Target potential mispricing by reviewing companies highlighted in the 25 high quality undervalued stocks for ideas where quality and price may not fully match yet.
- Focus on resilience first and scan the 59 resilient stocks with low risk scores to see which companies score well on overall risk while still offering meaningful upside potential.
- Hunt for potential future leaders by checking the screener containing 73 high quality undiscovered gems, which surfaces lesser known stocks that still show strong fundamentals.
This article by Simply Wall St is general in nature. We provide commentary based on historical data and analyst forecasts only using an unbiased methodology and our articles are not intended to be financial advice. It does not constitute a recommendation to buy or sell any stock, and does not take account of your objectives, or your financial situation. We aim to bring you long-term focused analysis driven by fundamental data. Note that our analysis may not factor in the latest price-sensitive company announcements or qualitative material. Simply Wall St has no position in any stocks mentioned.
Have feedback on this article? Concerned about the content? Get in touch with us directly. Alternatively, email editorial-team@simplywallst.com