
Eli Lilly (LLY) Stock Trades Below Fair Value On Cash Flow
Eli Lilly stock has logged very strong gains over the past few years, yet the latest valuation checks send a mixed message about where fair value may sit. The intrinsic value estimate from a Discounted Cash Flow (DCF) model points to a meaningful discount, while the broader set of valuation checks does not present Eli Lilly as an obvious bargain or an obvious premium.
- Eli Lilly has delivered a return of about 399.8% over the past 5 years, which puts extra focus on whether the current share price still lines up with its underlying cash flow outlook.
- The Phase 3 results for obesity drug retatrutide and expectations tied to Eli Lilly's wider metabolic and central nervous system pipeline can support high growth assumptions. At the same time, execution and regulatory risks around these same programs may weigh on how much investors are willing to pay today.
- On the blended checks, Eli Lilly shows a mixed picture rather than a clear bargain or clear overvaluation. Its overall value score of 3 suggests that different valuation tools are not all pointing in the same direction.
The issue now is whether Eli Lilly's current market price already reflects these strong expectations or if the Discounted Cash Flow intrinsic value estimate still indicates room for further upside.
Spot opportunities beyond Eli Lilly by scanning a curated list of companies with strong cash flows and supportive valuations using the 49 high quality undervalued stocks.Is Eli Lilly Still Cheap on Cash Flow?
The Discounted Cash Flow (DCF) model here focuses on the cash Eli Lilly is expected to generate for shareholders over time. On this view, Eli Lilly is treated as a business with growing free cash flow, not a shrinking one.
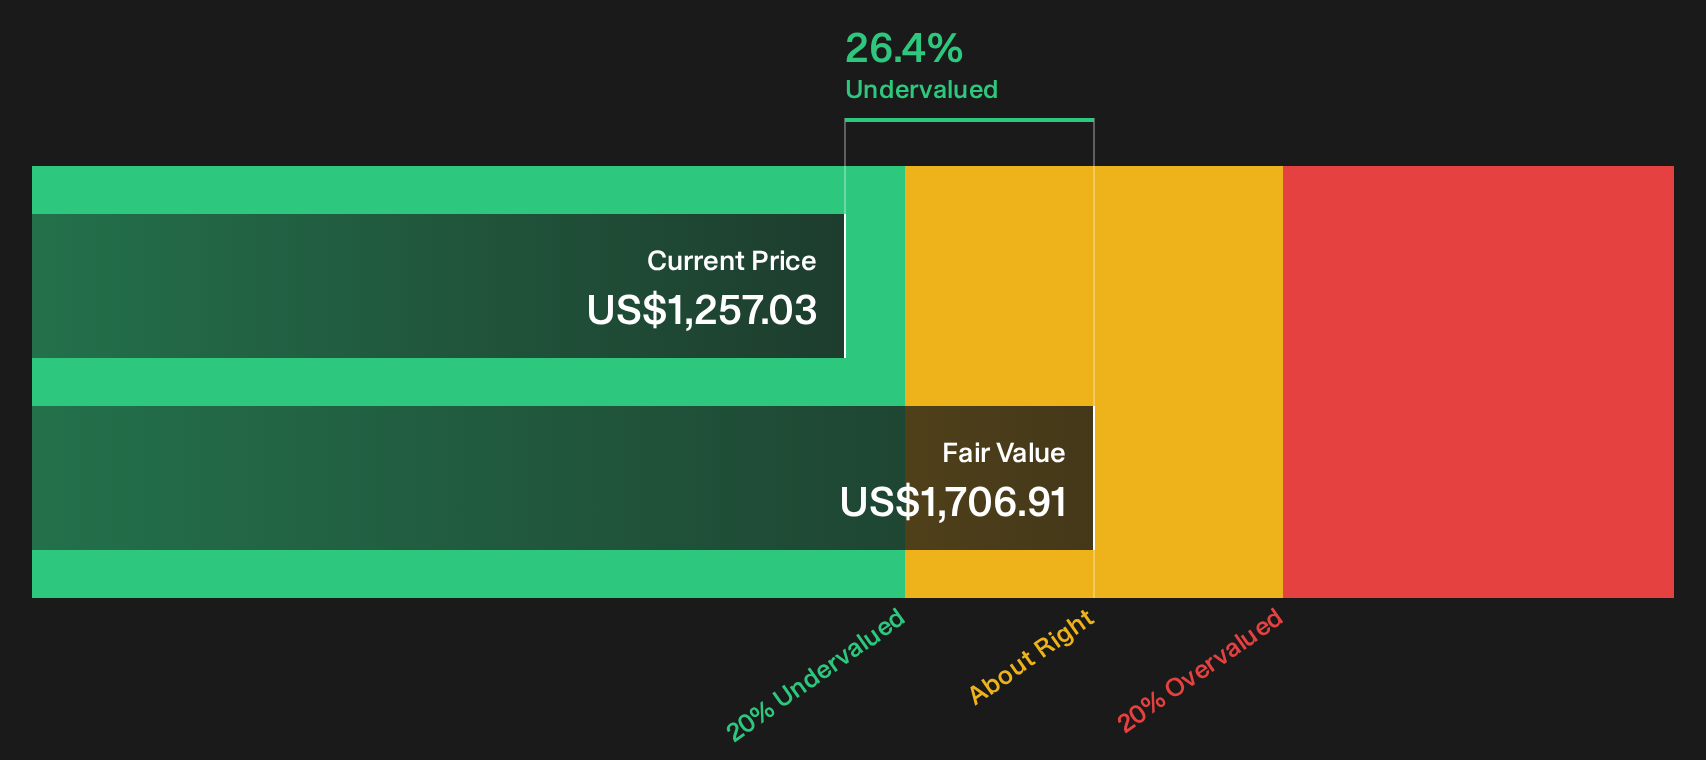
The model uses latest twelve month free cash flow of about $13.6b and projects higher cash flows ahead, which leads to an estimated intrinsic value of about $1,688 per share. Compared with the current share price, that implies the stock screens around 26.9% undervalued on this cash flow outlook. The strong Phase 3 results for obesity drug retatrutide and Lilly’s broader metabolic pipeline help explain why the DCF embeds solid growth, even though execution and regulatory risks remain in the background.
On the DCF numbers alone, Eli Lilly stock looks undervalued relative to the cash flows that analysts currently expect.
Our Discounted Cash Flow (DCF) analysis suggests Eli Lilly is undervalued by 26.9%. Track this in your watchlist or portfolio, or discover 49 more high quality undervalued stocks.
Does Eli Lilly Look Fairly Valued on Earnings?
The P/E ratio is a useful way to sanity check what you are paying for each dollar of Eli Lilly earnings. It allows a direct comparison with other pharmaceutical stocks that are also valued on near term profit.
Eli Lilly currently trades on a P/E of about 41.2x. That is well above the broader pharmaceuticals industry average of 16.8x, yet it sits below the peer group average of 51.4x for companies with similar profiles. The tailored fair P/E ratio for Eli Lilly is estimated at 40.3x, which is only slightly below the current multiple.
This small gap suggests that, even after strong interest in Eli Lilly's obesity and central nervous system pipeline, the P/E is not out of line with what the model suggests for its growth, margins and risk profile. The stock neither screens like a clear bargain nor an aggressive premium purely on earnings.
On the P/E lens, Eli Lilly looks priced roughly in line with what its earnings profile would suggest.

See what the numbers say about this price — find out in our valuation breakdown.
The Eli Lilly Narrative: What Would Justify Today's Price?
Simply Wall St Narratives aim to connect Eli Lilly's current valuation puzzle with specific assumptions about its future growth, margins and earnings, so you can see what would need to happen for the stock to be worth materially more or less than today’s price. Each Narrative links its number to a clear view of how Eli Lilly's growth, profitability and risks could evolve, which you can revisit as new information becomes available.
Community views on Eli Lilly could hardly be further apart, even though both sides describe the stock as roughly fairly valued.
Bull case: roughly fairly valued
"Advancements in research and development, particularly in neurodegenerative diseases, and a deep clinical pipeline with multiple late-stage readouts, position Eli Lilly to capture future multi-billion dollar market opportunities and support long-term revenue and margin expansion..."
Read the full Bull Case to see why Eli Lilly could be undervalued
Bear case: roughly fairly valued
"P/E ratio is currently quite high at the moment but is reflected based on projected growth..."
Read the full Bear Case to see why Eli Lilly could be overvalued
Do you think there's more to the story for Eli Lilly? Head over to our Community to see what others are saying!
The Bottom Line
For Eli Lilly, the Discounted Cash Flow (DCF) view points to meaningful undervaluation, while the earnings multiple suggests the stock is priced about right relative to its peer group. The gap mainly reflects how the DCF leans on long term cash flow strength, whereas the market multiple already embeds high expectations after a very strong share price move. With broader valuation checks sending a mixed signal, the key question is whether Eli Lilly can deliver on its metabolic and central nervous system pipeline without stumbles that would challenge those optimistic cash flow assumptions.
This article by Simply Wall St is general in nature. We provide commentary based on historical data and analyst forecasts only using an unbiased methodology and our articles are not intended to be financial advice. It does not constitute a recommendation to buy or sell any stock, and does not take account of your objectives, or your financial situation. We aim to bring you long-term focused analysis driven by fundamental data. Note that our analysis may not factor in the latest price-sensitive company announcements or qualitative material. Simply Wall St has no position in any stocks mentioned.
Have feedback on this article? Concerned about the content? Get in touch with us directly. Alternatively, email editorial-team@simplywallst.com