
3 TSX Stocks That Could Be Trading Below Their Estimated Value
The Canadian market has recently experienced volatility, influenced by rising long-term bond yields and concerns about the economy's ability to withstand higher borrowing costs. Despite these challenges, resilient economic activity and strong corporate profits suggest potential opportunities for investors. In this environment, identifying stocks that may be trading below their estimated value can be a strategic move, as they offer the possibility of growth when broader market conditions stabilize.
Top 10 Undervalued Stocks Based On Cash Flows In Canada
| Name | Current Price | Fair Value (Est) | Discount (Est) |
| Wesdome Gold Mines (TSX:WDO) | CA$36.00 | CA$71.51 | 49.7% |
| Tantalus Systems Holding (TSX:GRID) | CA$3.99 | CA$7.17 | 44.3% |
| Pan American Silver (TSX:PAAS) | CA$74.86 | CA$139.81 | 46.5% |
| NFI Group (TSX:NFI) | CA$22.24 | CA$43.02 | 48.3% |
| Groupe Dynamite (TSX:GRGD) | CA$64.36 | CA$116.01 | 44.5% |
| Gildan Activewear (TSX:GIL) | CA$75.50 | CA$147.21 | 48.7% |
| Endeavour Mining (TSX:EDV) | CA$90.85 | CA$180.57 | 49.7% |
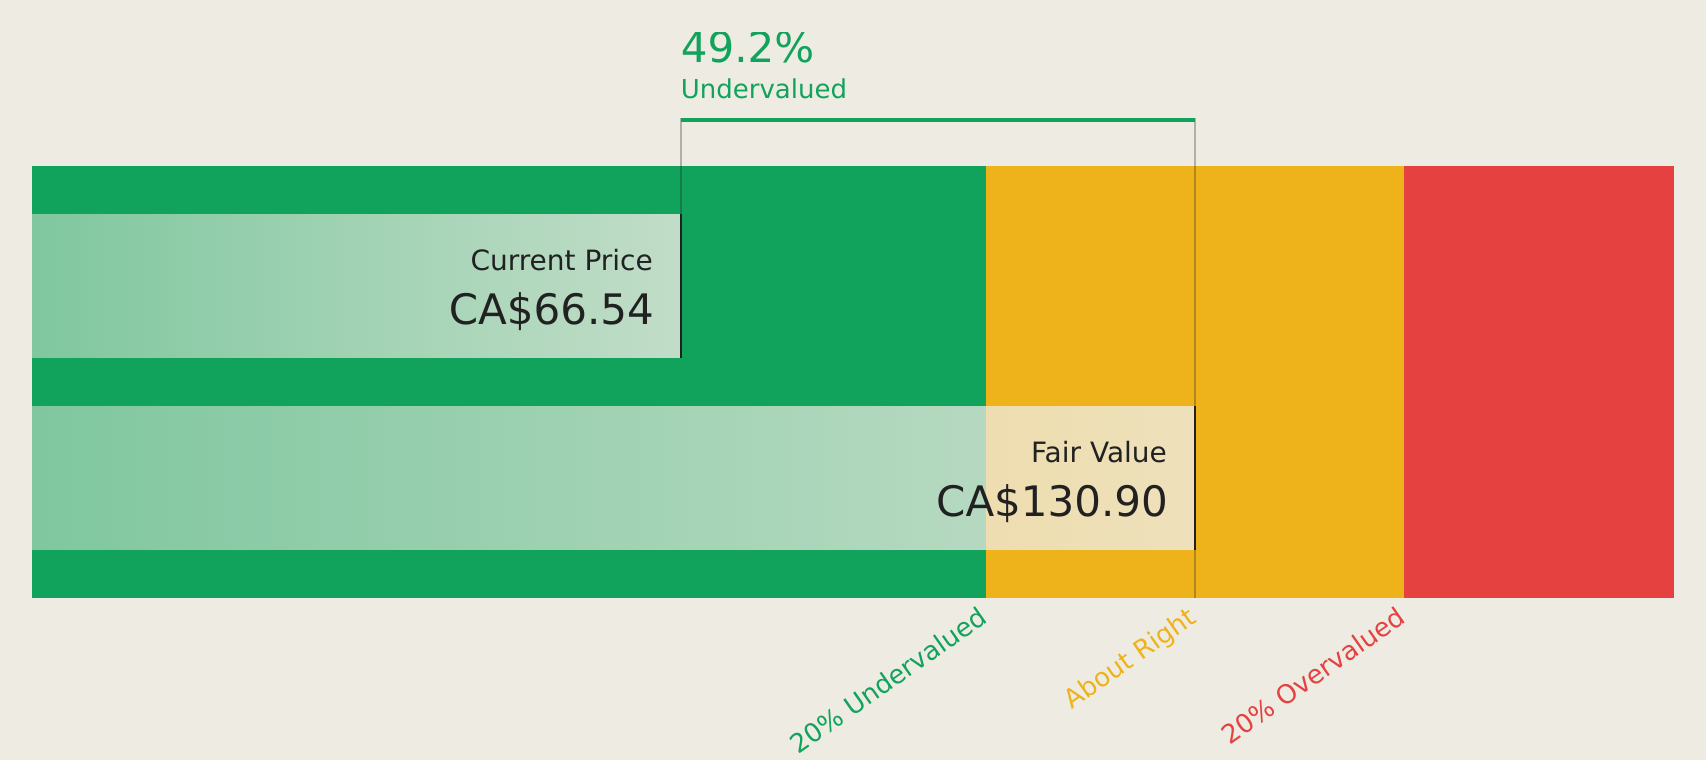
| Eldorado Gold (TSX:ELD) | CA$66.50 | CA$130.80 | 49.2% |
| Constellation Software (TSX:CSU) | CA$3078.66 | CA$5922.23 | 48% |
| Aritzia (TSX:ATZ) | CA$130.93 | CA$247.64 | 47.1% |
Let's take a closer look at a couple of our picks from the screened companies.
Eldorado Gold (TSX:ELD)
Overview: Eldorado Gold Corporation, along with its subsidiaries, is involved in the mining, exploration, development, and sale of mineral products mainly in Turkey, Canada, and Greece with a market cap of CA$16.76 billion.
Operations: The company generates revenue of $2.03 billion from its mining, exploration, and development activities.
Estimated Discount To Fair Value: 49.2%
Eldorado Gold is trading at CA$66.5, significantly below its estimated future cash flow value of CA$130.8, indicating it may be undervalued based on cash flows. The company forecasts robust earnings growth of 23% annually, outpacing the Canadian market's 10.7%. Recent leadership changes and strategic acquisitions, including Foran Mining and the McIlvenna Bay Project, bolster its portfolio diversification and long-term cash flow potential despite past shareholder dilution.
- Insights from our recent growth report point to a promising forecast for Eldorado Gold's business outlook.
- Unlock comprehensive insights into our analysis of Eldorado Gold stock in this financial health report.
FirstService (TSX:FSV)
Overview: FirstService Corporation, with a market cap of CA$8.77 billion, operates in the United States and Canada offering residential property management and essential property services to both residential and commercial customers.
Operations: The company's revenue is derived from two primary segments: First Service Brands, contributing $3.27 billion, and First Service Residential, contributing $2.33 billion.
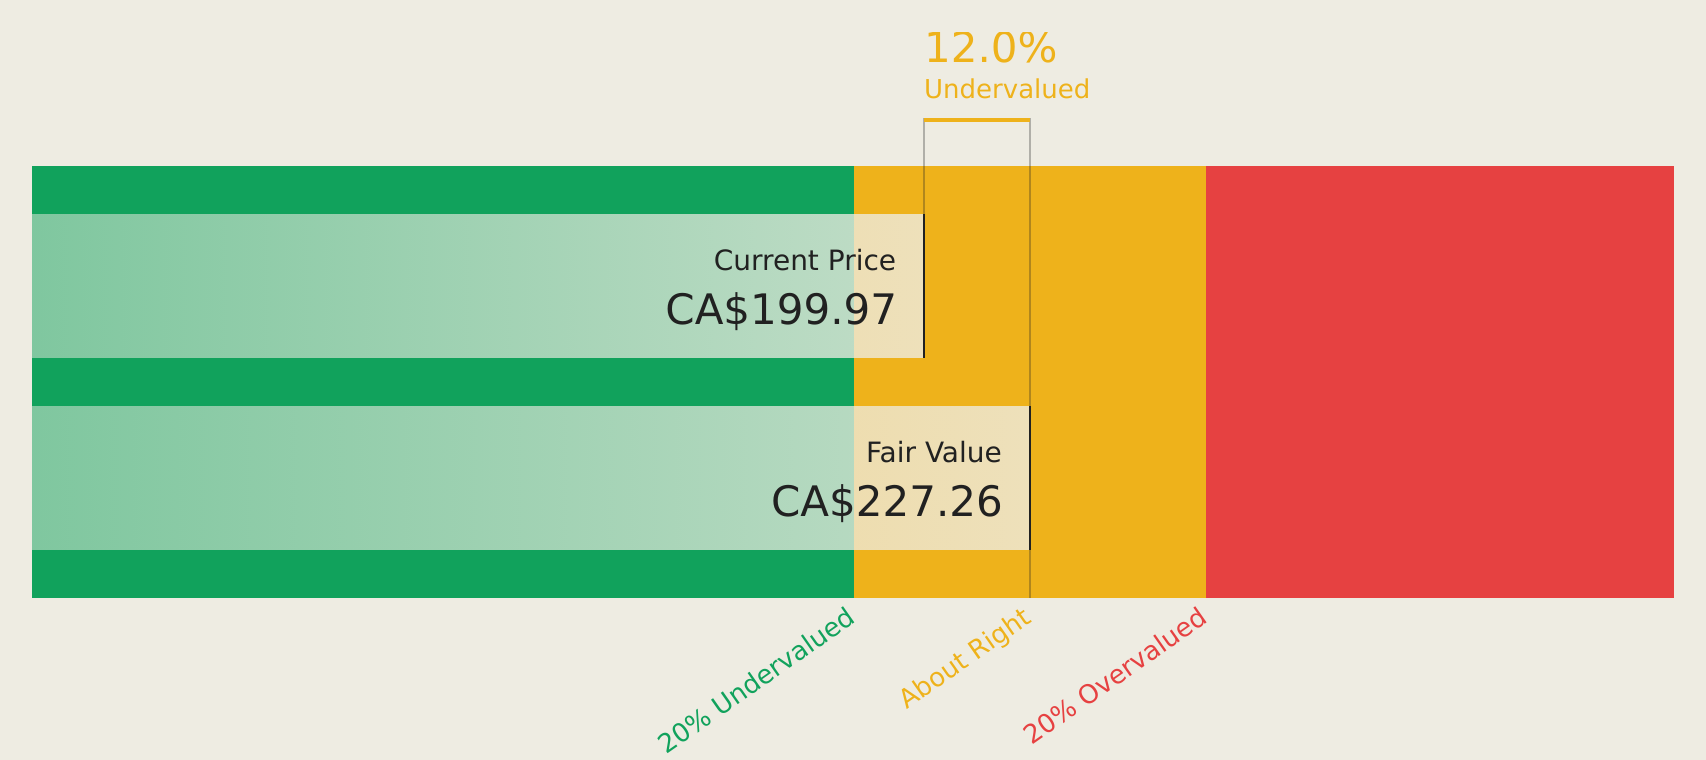
Estimated Discount To Fair Value: 15.7%
FirstService is trading at CA$198.94, below its estimated future cash flow value of CA$235.87, potentially offering value based on cash flows. Despite high debt levels, the company forecasts earnings growth of 11.6% annually, outpacing the Canadian market's 10.8%. Recent earnings showed stable revenue and net income performance with strategic initiatives like Resilience First enhancing community risk management capabilities and supporting long-term operational efficiency and resilience in property management services.
- The analysis detailed in our FirstService growth report hints at robust future financial performance.
- Navigate through the intricacies of FirstService with our comprehensive financial health report here.
Firan Technology Group (TSX:FTG)
Overview: Firan Technology Group Corporation manufactures and sells aerospace and defense electronic products and subsystems internationally, with a market cap of CA$472.25 million.
Operations: The company's revenue segments include CA$128.46 million from Circuits and CA$74.58 million from Aerospace.
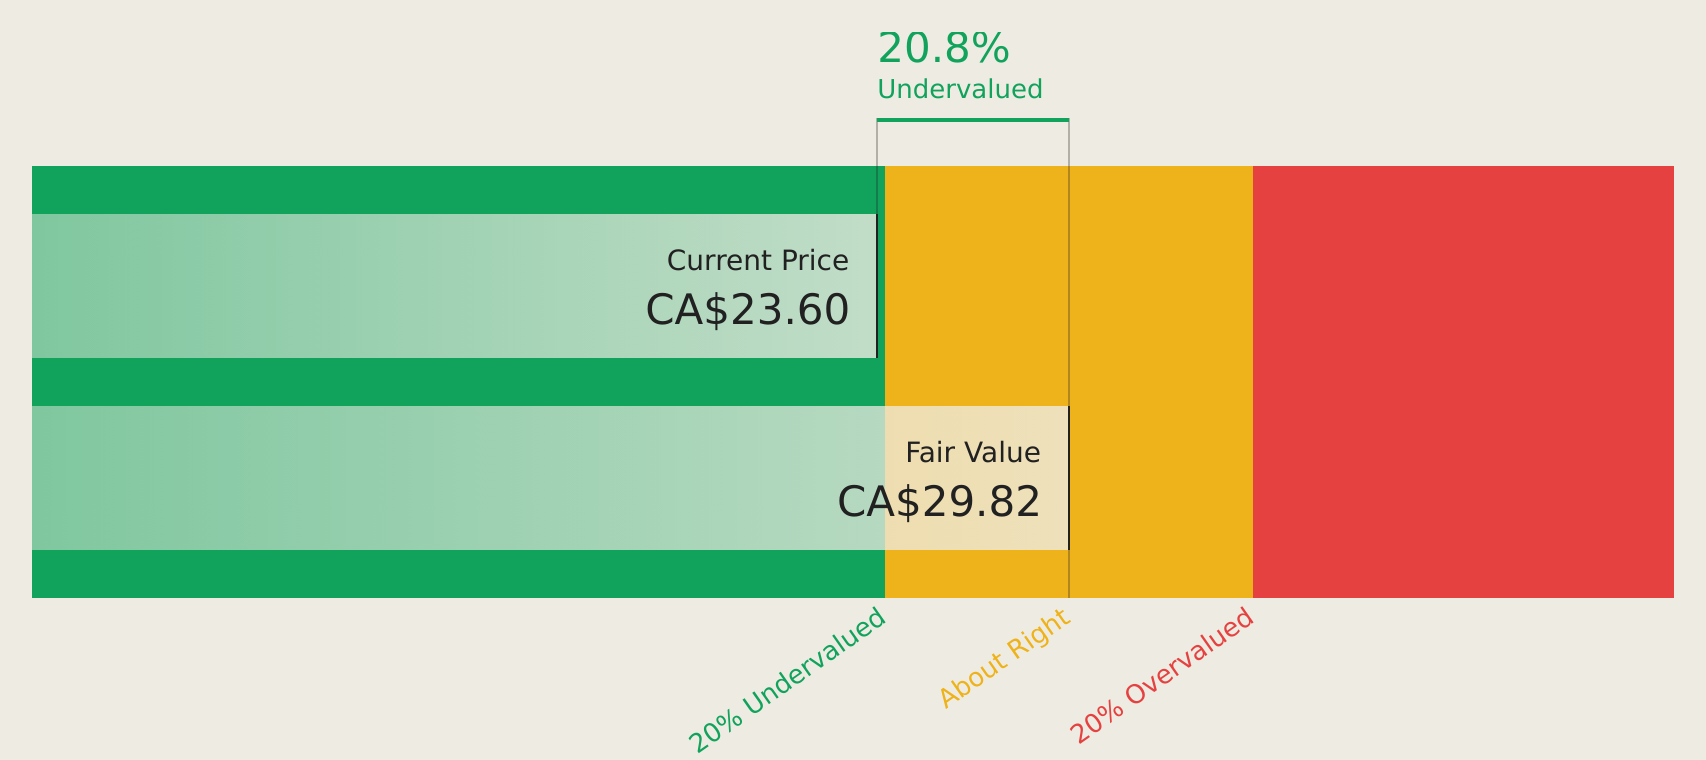
Estimated Discount To Fair Value: 31.8%
Firan Technology Group is trading at CA$20.09, significantly below its estimated future cash flow value of CA$29.47, highlighting potential undervaluation based on cash flows. The company reported strong earnings growth with net income rising to CA$5.04 million in Q2 2026 from CA$3.48 million the previous year. With a forecasted annual earnings growth of over 21%, FTG's strategic expansion into India aims to capture new aerospace market opportunities and reduce trade policy risks.
- Our comprehensive growth report raises the possibility that Firan Technology Group is poised for substantial financial growth.
- Take a closer look at Firan Technology Group's balance sheet health here in our report.
Seize The Opportunity
- Explore the 32 names from our Undervalued TSX Stocks Based On Cash Flows screener here.
- Are you invested in these stocks already? Keep abreast of every twist and turn by setting up a portfolio with Simply Wall St, where we make it simple for investors like you to stay informed and proactive.
- Take control of your financial future using Simply Wall St, offering free, in-depth knowledge of international markets to every investor.
Contemplating Other Strategies?
- Explore high-performing small cap companies that haven't yet garnered significant analyst attention.
- Diversify your portfolio with solid dividend payers offering reliable income streams to weather potential market turbulence.
- Fuel your portfolio with companies showing strong growth potential, backed by optimistic outlooks both from analysts and management.
This article by Simply Wall St is general in nature. We provide commentary based on historical data and analyst forecasts only using an unbiased methodology and our articles are not intended to be financial advice. It does not constitute a recommendation to buy or sell any stock, and does not take account of your objectives, or your financial situation. We aim to bring you long-term focused analysis driven by fundamental data. Note that our analysis may not factor in the latest price-sensitive company announcements or qualitative material. Simply Wall St has no position in any stocks mentioned.
Have feedback on this article? Concerned about the content? Get in touch with us directly. Alternatively, email editorial-team@simplywallst.com