
What Is Drawing Attention To Forestar Group (FOR) Today?
Forestar Group stock overview
Forestar Group (FOR) is drawing investor attention as a US residential lot developer with US$1.7b in revenue and US$170.4m in net income. The company operates as a subsidiary of D.R. Horton.
Forestar Group’s share price has eased recently, with a 1-month share price return of 2.45% and a 7-day share price return of 0.90% lower. Yet the year-to-date share price return of 17.68% and 90-day gain of 4.19% suggest momentum has been building over a longer stretch, while the 5-year total shareholder return of 39.20% shows how patience has been rewarded.
Compare Forestar Group’s momentum with a curated set of housing related developers and builders by scanning the list of solid balance sheet and fundamentals (50 results).
Recent weakness after a strong multi year run raises a simple question for Forestar Group investors: Are prices now tracking the company’s US$1.7b business and US$170.4m earnings, or mainly a reset in sentiment heading into valuation work next?
Most Popular Narrative: 15.8% Undervalued
The most followed valuation narrative pegs Forestar Group’s fair value at $34, compared with the last close of $28.62, which implies a meaningful gap between price and that fair value estimate.
Forestar's capital-efficient, disciplined development model, supported by a strong balance sheet and high liquidity, enables the company to manage working capital efficiently, execute selective land acquisition despite tighter credit across the industry, and deliver robust returns on invested capital, driving higher net margins and sustained long-term EPS growth. Despite moderating near-term lot delivery guidance, stabilized development costs, pricing power due to a national shortage of finished lots, and favorable mix shifts are enabling the company to maintain revenue guidance and drive average selling prices higher, underpinning gradual gross margin recovery and supporting medium-term profitability.
Want to see what sits beneath that $34 fair value for Forestar Group? The narrative is based on a mix of steady revenue, slimmer margins, and a higher future earnings multiple. Curious how those moving pieces combine under a 9.67% discount rate to support an undervalued assessment without assuming rapid growth? The full narrative lays out the numbers and the logic behind them.
Result: Fair Value of $34 (UNDERVALUED)
Have a read of the narrative in full and understand what's behind the forecasts.
However, investors also need to weigh Forestar Group’s reliance on D.R. Horton for lot sales, as well as the pressure from recently thinner gross margins that management expects near the low end of past ranges.
Find out about the key risks to this Forestar Group narrative.
Another view on Forestar Group’s valuation
The first narrative leaned on future earnings and a higher P/E multiple to argue that Forestar Group is undervalued at $28.62 versus a $34 fair value. A different approach that uses the Simply Wall St DCF model points the other way and suggests the stock trades above an estimated future cash flow value of $21.15.
This gap between earnings based upside and cash flow based caution highlights the importance of deciding which set of assumptions you trust more, and how much room for error you are comfortable with as an investor.
Look into how the SWS DCF model arrives at its fair value.
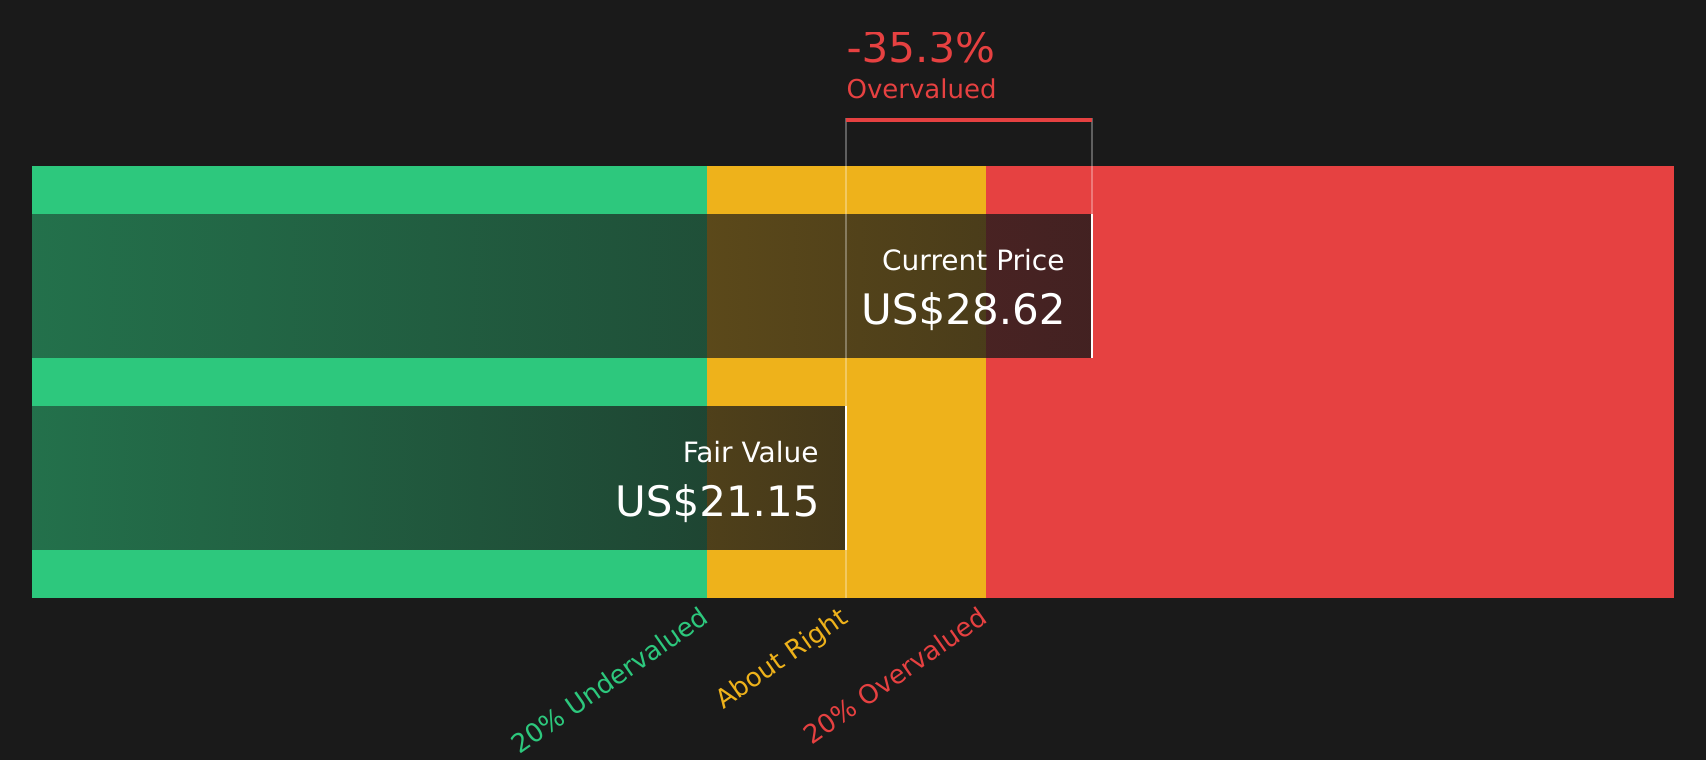
Simply Wall St performs a discounted cash flow (DCF) on every stock in the world every day (check out Forestar Group for example). We show the entire calculation in full. You can track the result in your watchlist or portfolio and be alerted when this changes, or use our stock screener to discover 46 high quality undervalued stocks. If you save a screener we even alert you when new companies match - so you never miss a potential opportunity.
Next Steps
The mix of optimism and concern around Forestar Group is clear, so it makes sense to review the numbers yourself and decide quickly what you think. To see both sides laid out in one place, take a closer look at the 3 key rewards and 1 important warning sign.
Looking for more investment ideas beyond Forestar Group?
If Forestar Group has your attention, do not stop here. Fresh ideas often come from comparing different business models, balance sheets, and risk profiles side by side.
- Spot potential value opportunities early by scanning a curated 20 high quality undiscovered gems before they draw wider market attention.
- Prioritise resilience and sleep easier at night by focusing on companies in the 76 resilient stocks with low risk scores that score well on risk factors.
- Hunt for quality at a reasonable price by checking the 46 high quality undervalued stocks that combine fundamentals with attractive valuations.
This article by Simply Wall St is general in nature. We provide commentary based on historical data and analyst forecasts only using an unbiased methodology and our articles are not intended to be financial advice. It does not constitute a recommendation to buy or sell any stock, and does not take account of your objectives, or your financial situation. We aim to bring you long-term focused analysis driven by fundamental data. Note that our analysis may not factor in the latest price-sensitive company announcements or qualitative material. Simply Wall St has no position in any stocks mentioned.
Have feedback on this article? Concerned about the content? Get in touch with us directly. Alternatively, email editorial-team@simplywallst.com