
3 Asian Stocks That Could Be Trading Below Their Intrinsic Value By At Least 28.6%
As Asian markets navigate a landscape marked by mixed economic signals and investor sentiment, opportunities may arise for discerning investors to identify stocks trading below their intrinsic value. In this context, a good stock is one that demonstrates strong fundamentals and potential for growth despite current market fluctuations, offering the possibility of being undervalued in today's environment.
Top 10 Undervalued Stocks Based On Cash Flows In Asia
| Name | Current Price | Fair Value (Est) | Discount (Est) |
| Sansha Electric ManufacturingLtd (TSE:6882) | ¥1175.00 | ¥2309.90 | 49.1% |
| Quality Reliability Technology (KOSDAQ:A405100) | ₩12580.00 | ₩24768.35 | 49.2% |
| Moshi Moshi Retail Corporation (SET:MOSHI) | THB38.25 | THB75.49 | 49.3% |
| Mao Geping Cosmetics (SEHK:1318) | HK$49.90 | HK$98.25 | 49.2% |
| gremsInc (TSE:3150) | ¥2488.00 | ¥4918.28 | 49.4% |
| Grand Process Technology (TPEX:3131) | NT$2485.00 | NT$4864.91 | 48.9% |
| GO (TSE:581A) | ¥4445.00 | ¥8775.46 | 49.3% |
| Delton Technology (Guangzhou) (SZSE:001389) | CN¥155.90 | CN¥306.39 | 49.1% |
| Beijing HyperStrong Technology (SHSE:688411) | CN¥190.05 | CN¥373.80 | 49.2% |
| BEAUTY GARAGE (TSE:3180) | ¥1560.00 | ¥3112.28 | 49.9% |
Let's dive into some prime choices out of the screener.
Meitu (SEHK:1357)
Overview: Meitu, Inc. is an investment holding company involved in developing and providing AI-powered photo, video, and design products in Mainland China and internationally, with a market cap of HK$21.62 billion.
Operations: The company generates revenue primarily from its Internet Business segment, which amounted to CN¥4.26 billion.
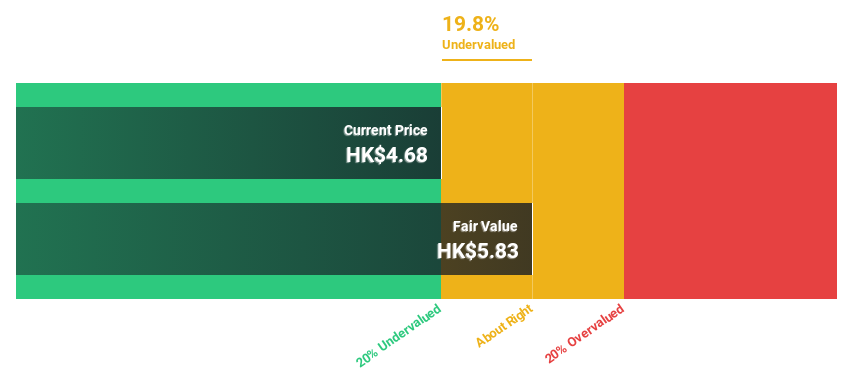
Estimated Discount To Fair Value: 33.8%
Meitu is trading at approximately 33.8% below its estimated fair value, presenting a potential opportunity for investors focused on cash flow valuation. Despite recent share price volatility, Meitu's earnings are forecasted to grow significantly at 30.7% annually over the next three years, outpacing market averages. Recent developments include a dividend increase and strategic board changes with Alibaba's involvement, potentially enhancing governance and growth prospects through increased expertise and strategic alignment.
- Upon reviewing our latest growth report, Meitu's projected financial performance appears quite optimistic.
- Unlock comprehensive insights into our analysis of Meitu stock in this financial health report.
FWD Group Holdings (SEHK:1828)
Overview: FWD Group Holdings Limited, along with its subsidiaries, offers life insurance products and services and has a market capitalization of HK$42.46 billion.
Operations: The company generates revenue primarily through its life and health insurance segment, amounting to $3.14 billion.
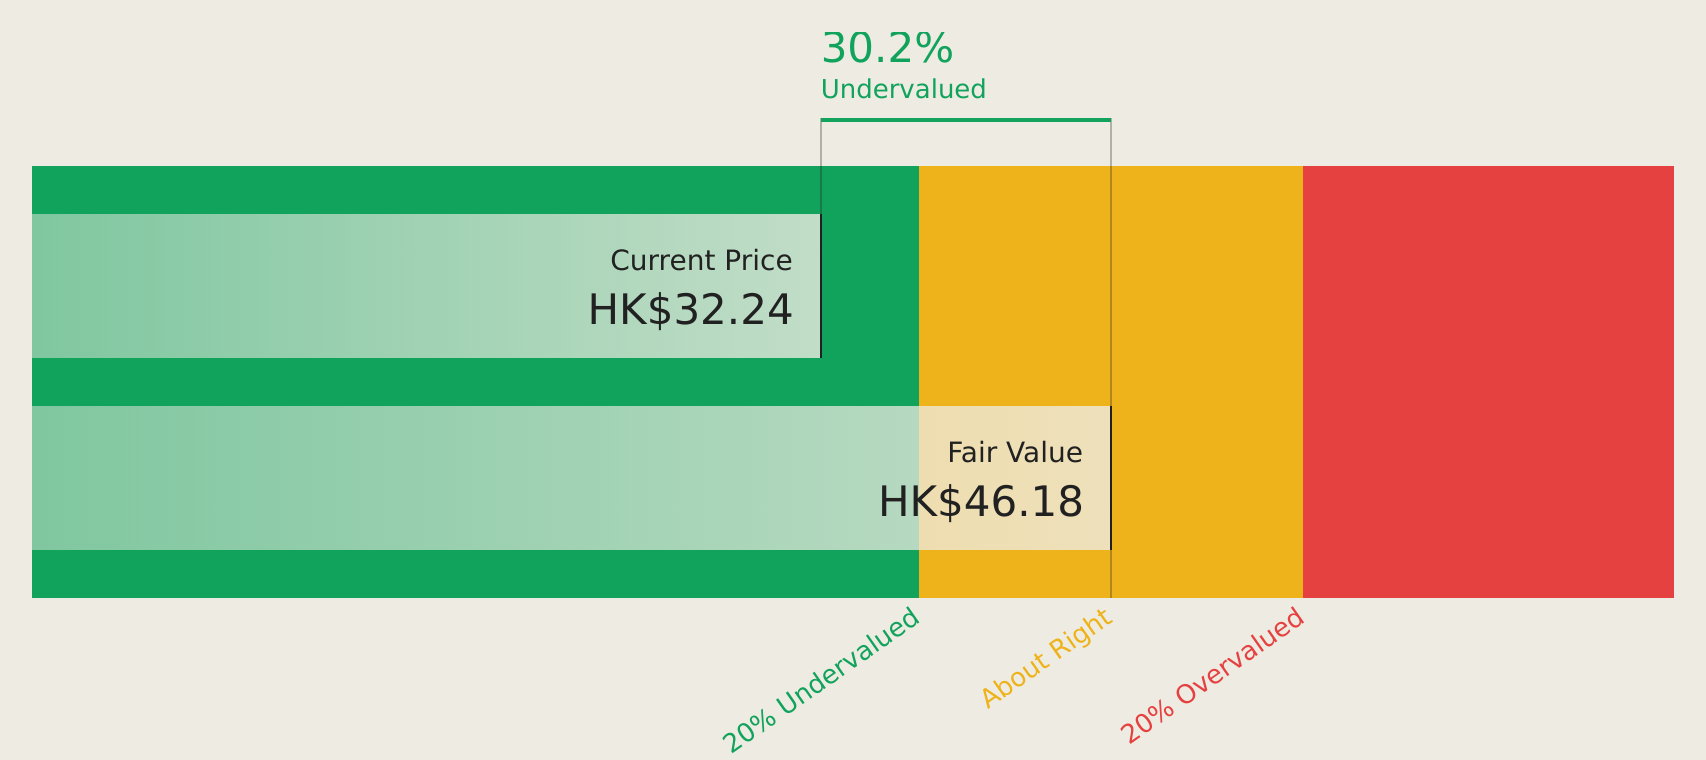
Estimated Discount To Fair Value: 28.6%
FWD Group Holdings is trading at 29% below estimated fair value, with its stock price significantly undervalued based on discounted cash flow analysis. The company reported a strong net income increase to US$172 million for H1 2026, reflecting robust growth. Earnings are projected to grow at 23.1% annually, surpassing Hong Kong market averages. Despite low forecasted return on equity of 9.9%, revenue growth is expected to be high at 30.5% annually over the next three years.
- In light of our recent growth report, it seems possible that FWD Group Holdings' financial performance will exceed current levels.
- Dive into the specifics of FWD Group Holdings here with our thorough financial health report.
GO (TSE:581A)
Overview: GO Inc. designs and develops a taxi-hailing application that enables users to arrange and schedule cab rides in Japan, with a market cap of ¥345.29 billion.
Operations: The company's revenue primarily comes from its GO Project segment, which generated ¥37.78 billion.
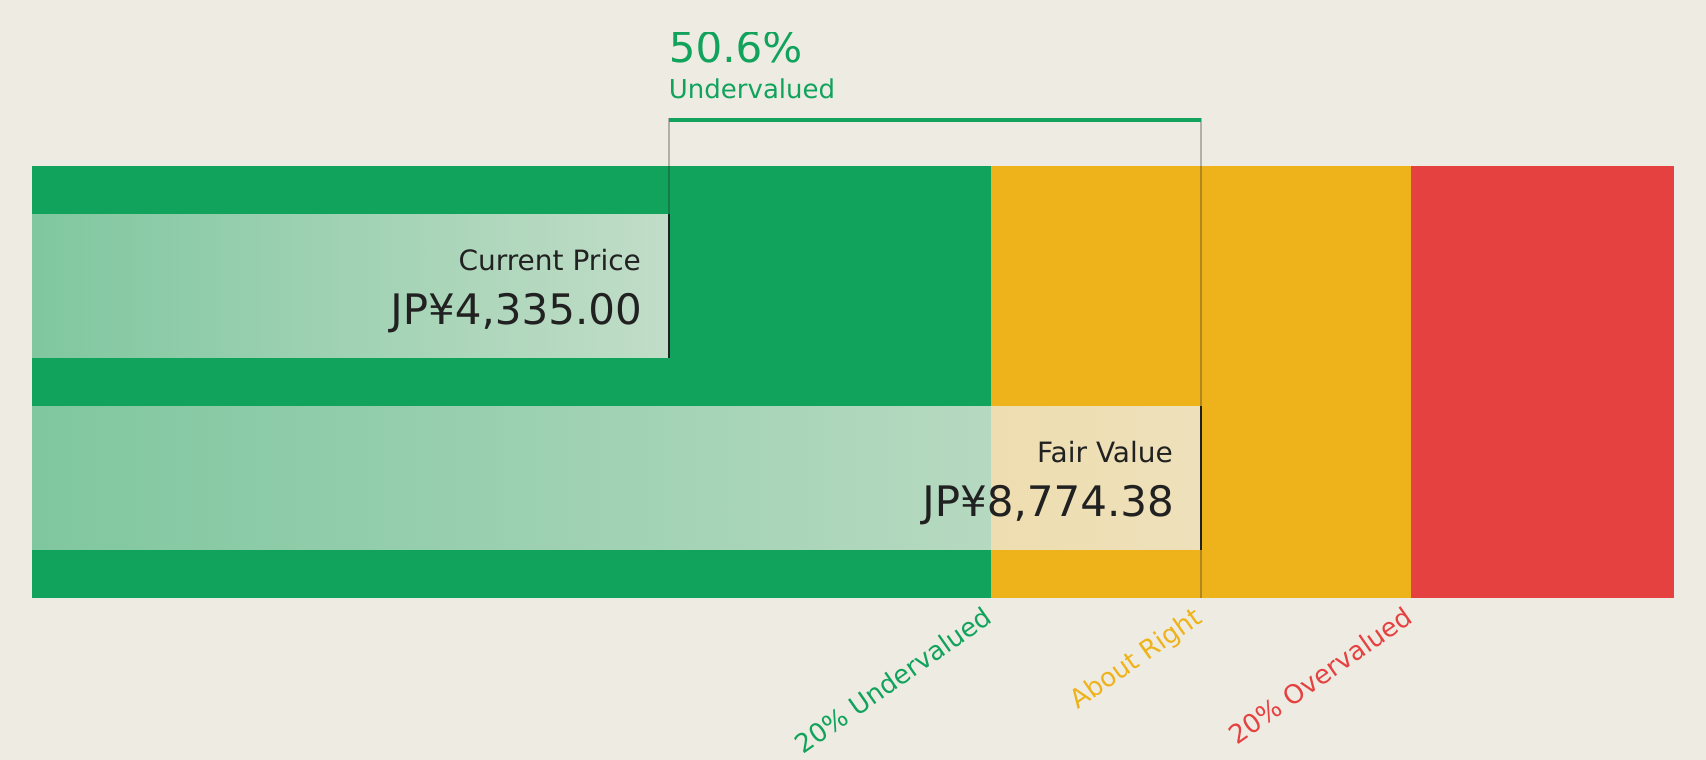
Estimated Discount To Fair Value: 49.3%
GO Inc. is trading at 49.3% below its estimated fair value, with a share price significantly undervalued by more than 20% based on future cash flow analysis. Despite recent volatility, earnings grew by a large margin last year and are expected to continue growing at 22.7% annually, outpacing the Japanese market average of 8.9%. The company forecasts net sales of ¥48,500 million and operating profit of ¥13,000 million for fiscal year ending May 2027.
- Our comprehensive growth report raises the possibility that GO is poised for substantial financial growth.
- Click here to discover the nuances of GO with our detailed financial health report.
Key Takeaways
- Take a closer look at our Undervalued Asian Stocks Based On Cash Flows list of 213 companies by clicking here.
- Shareholder in one or more of these companies? Ensure you're never caught off-guard by adding your portfolio in Simply Wall St for timely alerts on significant stock developments.
- Join a community of smart investors by using Simply Wall St. It's free and delivers expert-level analysis on worldwide markets.
Ready For A Different Approach?
- Explore high-performing small cap companies that haven't yet garnered significant analyst attention.
- Diversify your portfolio with solid dividend payers offering reliable income streams to weather potential market turbulence.
- Fuel your portfolio with companies showing strong growth potential, backed by optimistic outlooks both from analysts and management.
This article by Simply Wall St is general in nature. We provide commentary based on historical data and analyst forecasts only using an unbiased methodology and our articles are not intended to be financial advice. It does not constitute a recommendation to buy or sell any stock, and does not take account of your objectives, or your financial situation. We aim to bring you long-term focused analysis driven by fundamental data. Note that our analysis may not factor in the latest price-sensitive company announcements or qualitative material. Simply Wall St has no position in any stocks mentioned.
Have feedback on this article? Concerned about the content? Get in touch with us directly. Alternatively, email editorial-team@simplywallst.com