
Discover 3 European Stocks That May Be Priced Below Their Estimated Worth
As European markets navigate mixed economic signals and geopolitical developments, the pan-European STOXX Europe 600 Index has remained relatively steady, reflecting investor caution amid these uncertainties. In this environment, identifying stocks that may be undervalued can offer potential opportunities for investors seeking to capitalize on discrepancies between current market prices and intrinsic value estimates.
Top 10 Undervalued Stocks Based On Cash Flows In Europe
| Name | Current Price | Fair Value (Est) | Discount (Est) |
| ZEAL Network (XTRA:TIMA) | €43.80 | €87.47 | 49.9% |
| VIGO Photonics (WSE:VGO) | PLN482.00 | PLN960.59 | 49.8% |
| Tecan Group (SWX:TECN) | CHF194.40 | CHF385.99 | 49.6% |
| SP Group (CPSE:SPG) | DKK487.00 | DKK971.00 | 49.8% |
| RTL Group (XTRA:RRTL) | €32.05 | €64.08 | 50% |
| Metriks AI. Società Benefit (BIT:MTK) | €3.40 | €6.79 | 49.9% |
| Lime Technologies (OM:LIME) | SEK256.50 | SEK512.58 | 50% |
| Casta Diva Group (BIT:CDG) | €3.07 | €6.09 | 49.6% |
| BioMar Group (CPSE:BIOMAR) | DKK131.50 | DKK261.09 | 49.6% |
| Bénéteau (ENXTPA:BEN) | €5.81 | €11.58 | 49.8% |
Let's explore several standout options from the results in the screener.
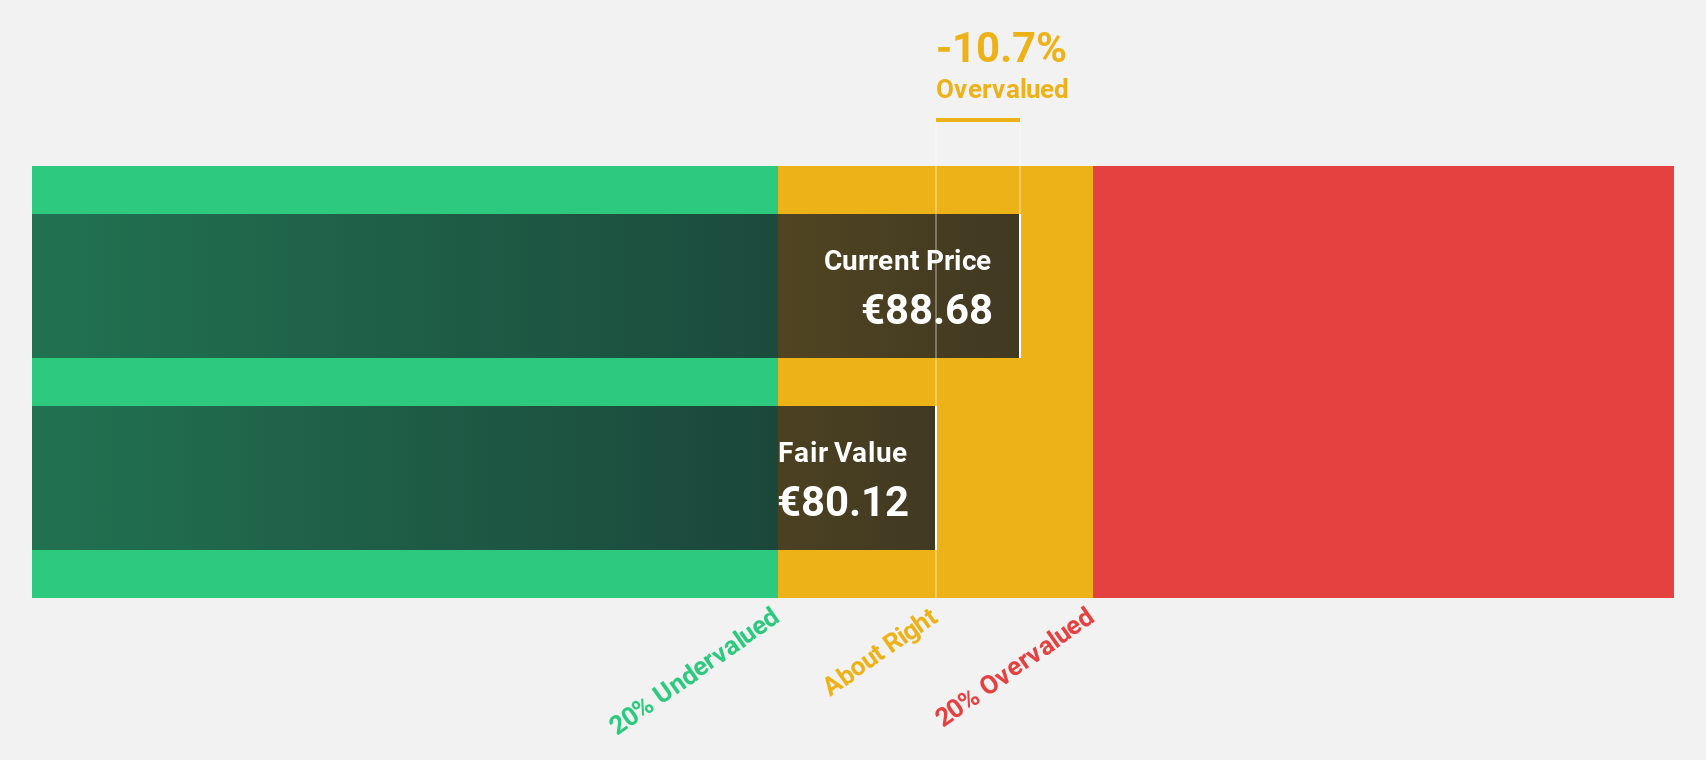
Airbus (ENXTPA:AIR)
Overview: Airbus SE, with a market cap of €160.71 billion, is involved in the design, manufacture, and delivery of aeronautics and aerospace products, services, and solutions globally.
Operations: The company generates revenue from its primary segments, with Airbus contributing €55.63 billion, Airbus Defence and Space providing €13.91 billion, and Airbus Helicopters adding €8.96 billion.
Estimated Discount To Fair Value: 26%
Airbus is trading at 26% below its estimated fair value, with a significant undervaluation based on discounted cash flow analysis. The company's revenue growth is projected to outpace the French market, and earnings are expected to grow faster than the market average. Recent strategic moves, such as a potential sale of its US small-satellite business and share repurchase program worth €5 billion, reflect proactive financial management aimed at optimizing cash flows.
- Our comprehensive growth report raises the possibility that Airbus is poised for substantial financial growth.
- Navigate through the intricacies of Airbus with our comprehensive financial health report here.
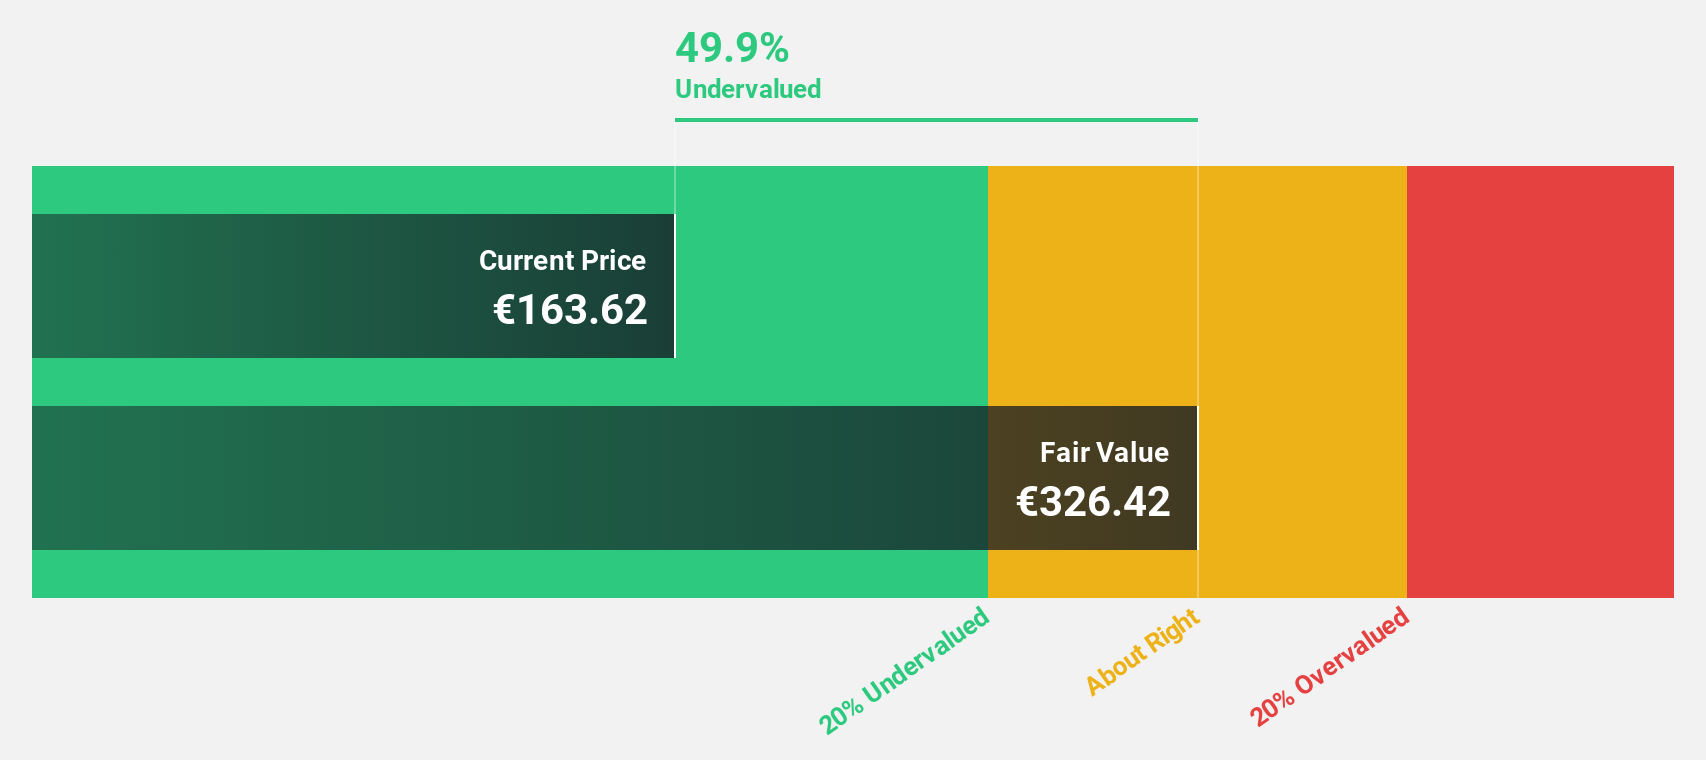
STMicroelectronics (ENXTPA:STMPA)
Overview: STMicroelectronics N.V. designs, develops, manufactures, and sells semiconductor products across Europe, the Middle East, Africa, the Americas, and the Asia Pacific with a market cap of approximately €38.68 billion.
Operations: STMicroelectronics generates revenue from its segments as follows: Embedded Processing ($4.11 billion), Analog, MEMS & Sensors Group ($5.63 billion), Power and Discrete Products ($1.69 billion), and RF & Optical Communications ($1.65 billion).
Estimated Discount To Fair Value: 49.5%
STMicroelectronics is trading significantly below its estimated fair value, with a valuation gap of over €40 based on discounted cash flow analysis. The company's revenue and earnings are projected to grow faster than the French market, despite recent profit margin declines. Strategic initiatives like the ST–NUS HELIX Corporate Lab and collaborations in edge AI technologies underscore its commitment to innovation. However, share price volatility remains a concern amidst these developments.
- Our earnings growth report unveils the potential for significant increases in STMicroelectronics' future results.
- Delve into the full analysis health report here for a deeper understanding of STMicroelectronics.
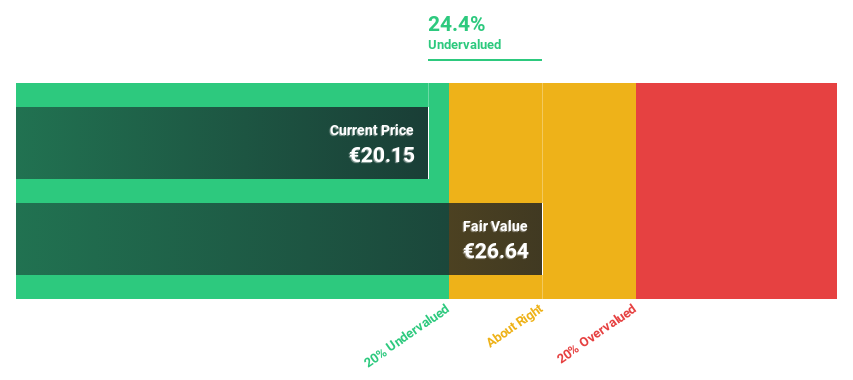
Siemens Energy (XTRA:ENR)
Overview: Siemens Energy AG is a global energy technology company with a market capitalization of approximately €128.04 billion.
Operations: The company's revenue segments include Gas Services (€13.42 billion), Siemens Gamesa (€10.37 billion), Grid Technologies (€12.89 billion), and Transformation of Industry (€5.87 billion).
Estimated Discount To Fair Value: 15.1%
Siemens Energy is trading slightly below its estimated cash flow value, presenting a modest valuation gap. Recent earnings reports show strong growth, with net income nearly doubling year-over-year. The company is exploring the sale of its steam turbine division, potentially valued at over €10 billion, which could enhance liquidity and focus on core operations. Forecasts suggest robust earnings growth outpacing the German market, though revenue expansion remains moderate in comparison to profit increases.
- Our growth report here indicates Siemens Energy may be poised for an improving outlook.
- Click here to discover the nuances of Siemens Energy with our detailed financial health report.
Next Steps
- Get an in-depth perspective on all 214 Undervalued European Stocks Based On Cash Flows by using our screener here.
- Are you invested in these stocks already? Keep abreast of every twist and turn by setting up a portfolio with Simply Wall St, where we make it simple for investors like you to stay informed and proactive.
- Simply Wall St is a revolutionary app designed for long-term stock investors, it's free and covers every market in the world.
Want To Explore Some Alternatives?
- Explore high-performing small cap companies that haven't yet garnered significant analyst attention.
- Diversify your portfolio with solid dividend payers offering reliable income streams to weather potential market turbulence.
- Fuel your portfolio with companies showing strong growth potential, backed by optimistic outlooks both from analysts and management.
This article by Simply Wall St is general in nature. We provide commentary based on historical data and analyst forecasts only using an unbiased methodology and our articles are not intended to be financial advice. It does not constitute a recommendation to buy or sell any stock, and does not take account of your objectives, or your financial situation. We aim to bring you long-term focused analysis driven by fundamental data. Note that our analysis may not factor in the latest price-sensitive company announcements or qualitative material. Simply Wall St has no position in any stocks mentioned.
Have feedback on this article? Concerned about the content? Get in touch with us directly. Alternatively, email editorial-team@simplywallst.com