
3 UK Dividend Stocks To Consider With At Least 3.2% Yield
As the UK market grapples with external pressures, notably from China's economic slowdown impacting the FTSE 100, investors are increasingly seeking stability amidst volatility. In such times, dividend stocks can offer a potential source of steady income and resilience; here are three UK dividend stocks to consider that yield at least 3.2%.
Top 10 Dividend Stocks In The United Kingdom
| Name | Dividend Yield | Dividend Rating |
| Telecom Plus (LSE:TEP) | 5.71% | ★★★★★☆ |
| Pollen Street Group (LSE:POLN) | 6.53% | ★★★★★☆ |
| Multitude (LSE:0R4W) | 9.26% | ★★★★★☆ |
| MONY Group (LSE:MONY) | 6.20% | ★★★★★★ |
| James Halstead (AIM:JHD) | 6.45% | ★★★★★☆ |
| IG Group Holdings (LSE:IGG) | 3.44% | ★★★★★☆ |
| Dunelm Group (LSE:DNLM) | 8.05% | ★★★★★☆ |
| BTG Consulting (AIM:BTG) | 4.22% | ★★★★★☆ |
| Arbuthnot Banking Group (AIM:ARBB) | 6.67% | ★★★★★☆ |
| 4imprint Group (LSE:FOUR) | 3.96% | ★★★★★☆ |
Click here to see the full list of 43 stocks from our Top UK Dividend Stocks screener.
Let's explore several standout options from the results in the screener.
M.P. Evans Group (AIM:MPE)
Simply Wall St Dividend Rating: ★★★★☆☆
Overview: M.P. Evans Group PLC, with a market cap of £934.46 million, owns and develops oil palm plantations in Indonesia and Malaysia through its subsidiaries.
Operations: M.P. Evans Group PLC generates revenue primarily from its plantation operations in Indonesia, amounting to $370.89 million.
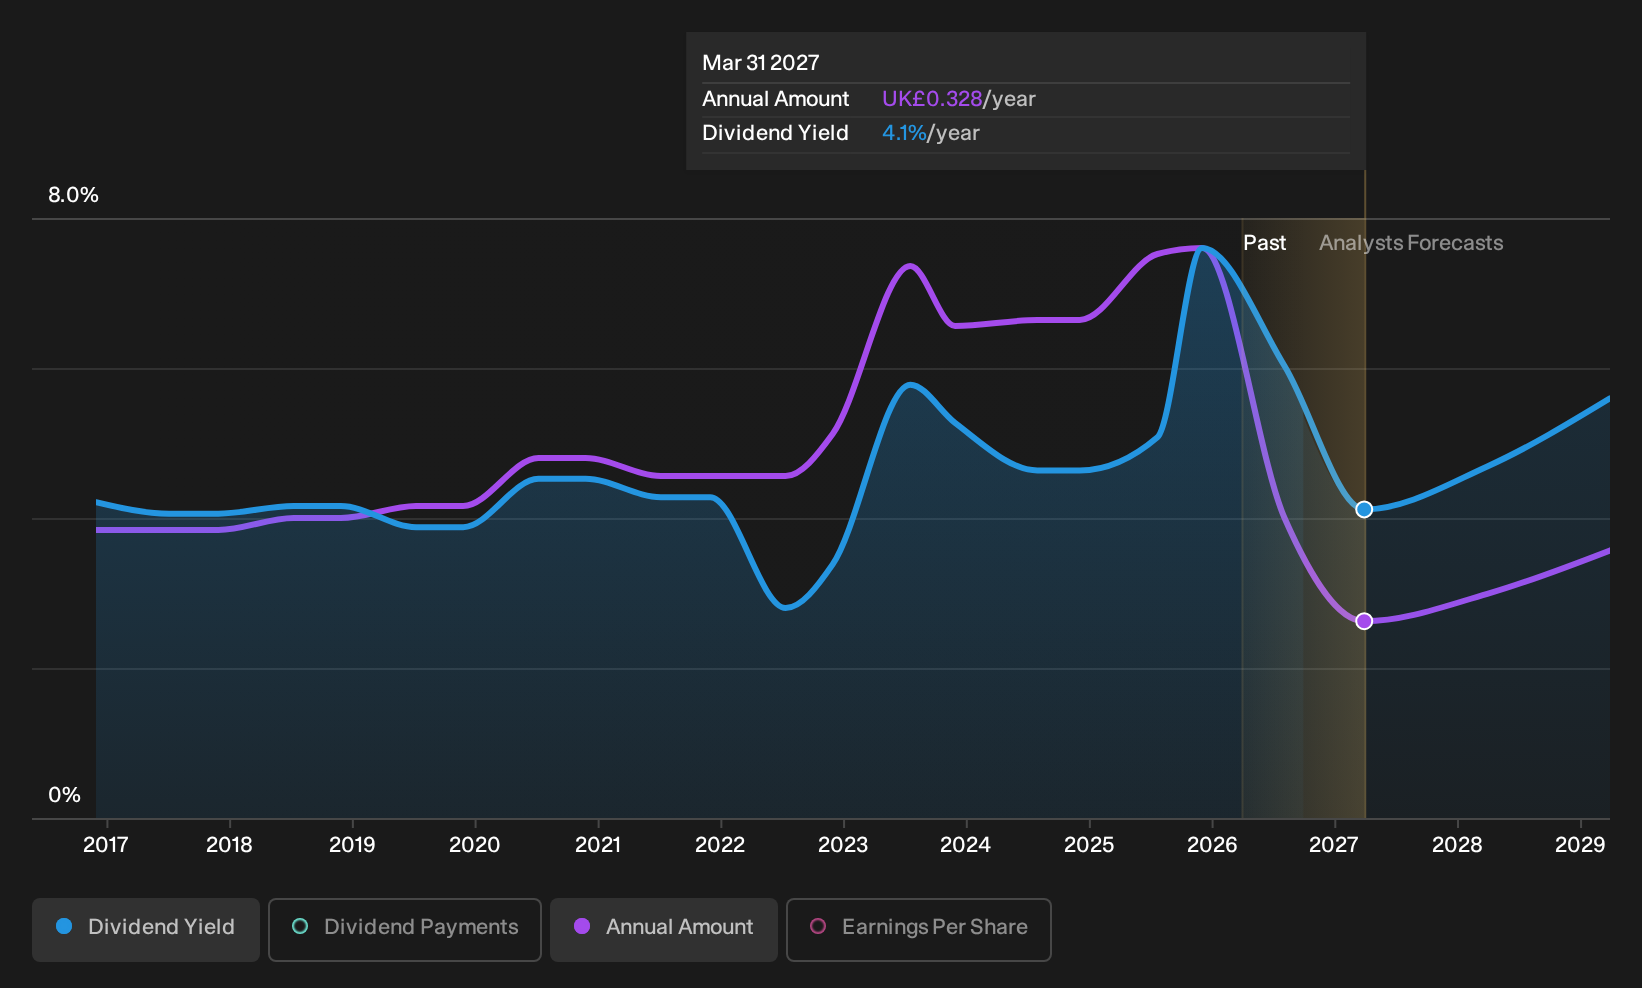
Dividend Yield: 3.2%
M.P. Evans Group has shown strong profit growth of 26.5% over the past year, and its dividend payments have increased over the last decade, although they remain volatile with an unreliable history. The company’s dividends are well-covered by earnings and cash flows, with payout ratios of 37.9% and 36.5%, respectively. Currently trading at a good value compared to peers, M.P. Evans’ recent production results showed increases in fresh fruit bunches and crude palm oil output for mid-2026.
- Click here and access our complete dividend analysis report to understand the dynamics of M.P. Evans Group.
- In light of our recent valuation report, it seems possible that M.P. Evans Group is trading behind its estimated value.
4imprint Group (LSE:FOUR)
Simply Wall St Dividend Rating: ★★★★★☆
Overview: 4imprint Group plc operates as a direct marketer of promotional products in North America, the United Kingdom, and Ireland, with a market cap of approximately £1.26 billion.
Operations: 4imprint Group plc generates its revenue primarily from North America, contributing $1.33 billion, and the UK & Ireland, contributing $25.60 million.
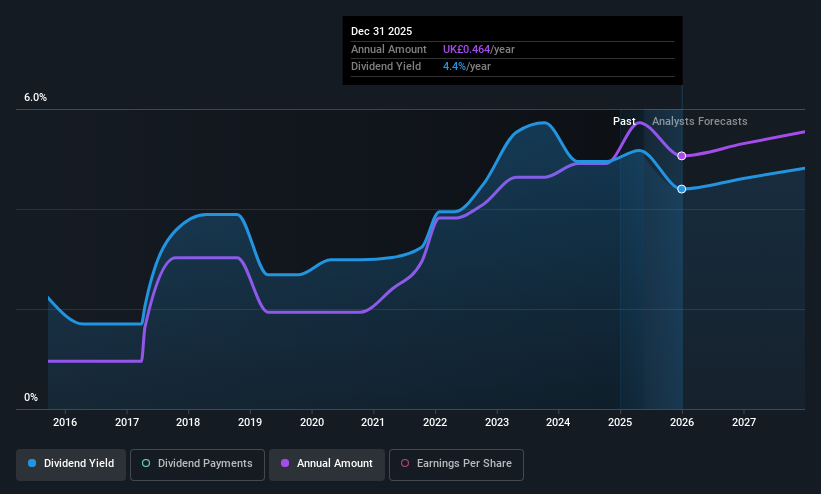
Dividend Yield: 4%
4imprint Group's dividend remains stable and reliable, with a consistent 10-year growth history. The interim dividend for 2026 is set at 80 cents per share, equivalent to 59.4 pence in Sterling, maintaining last year's payout level. Despite a decline in net income to US$43.5 million for H1 2026, dividends are sustainably covered by earnings and cash flows with payout ratios of approximately 66% and 62%, respectively. However, the yield of 3.96% is below top-tier UK payers.
- Dive into the specifics of 4imprint Group here with our thorough dividend report.
- Our valuation report unveils the possibility 4imprint Group's shares may be trading at a premium.
Telecom Plus (LSE:TEP)
Simply Wall St Dividend Rating: ★★★★★☆
Overview: Telecom Plus Plc offers utility services in the United Kingdom and has a market capitalization of £681.78 million.
Operations: Telecom Plus Plc generates revenue from its non-regulated utility segment, amounting to £1.94 billion.
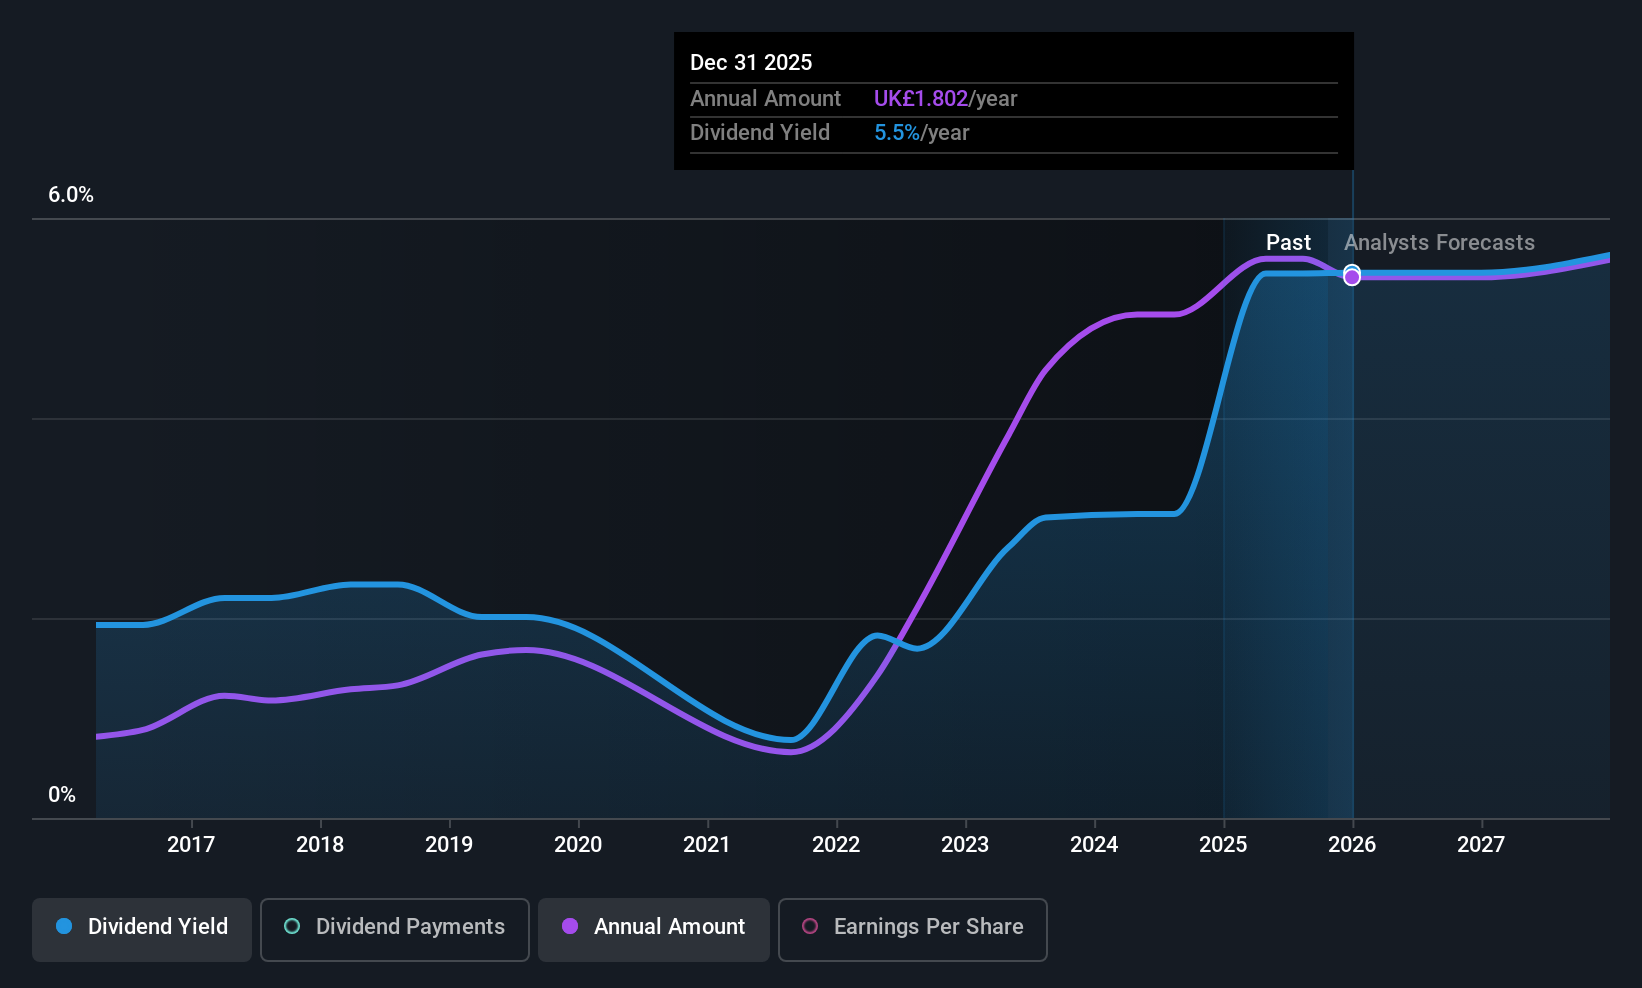
Dividend Yield: 5.7%
Telecom Plus's dividend profile is mixed, with a recent decrease in the final dividend to 12 pence per share, down from 57 pence last year, resulting in an annual total of 50 pence. Despite this volatility and a high debt level, dividends remain covered by earnings and cash flows, with payout ratios at 49.4% and 71.9%, respectively. The dividend yield of 5.71% ranks in the top UK payers but lacks stability over the past decade.
- Click to explore a detailed breakdown of our findings in Telecom Plus' dividend report.
- Insights from our recent valuation report point to the potential undervaluation of Telecom Plus shares in the market.
Key Takeaways
- Take a closer look at our Top UK Dividend Stocks list of 43 companies by clicking here.
- Are any of these part of your asset mix? Tap into the analytical power of Simply Wall St's portfolio to get a 360-degree view on how they're shaping up.
- Discover a world of investment opportunities with Simply Wall St's free app and access unparalleled stock analysis across all markets.
Curious About Other Options?
- Explore high-performing small cap companies that haven't yet garnered significant analyst attention.
- Fuel your portfolio with companies showing strong growth potential, backed by optimistic outlooks both from analysts and management.
- Find companies with promising cash flow potential yet trading below their fair value.
This article by Simply Wall St is general in nature. We provide commentary based on historical data and analyst forecasts only using an unbiased methodology and our articles are not intended to be financial advice. It does not constitute a recommendation to buy or sell any stock, and does not take account of your objectives, or your financial situation. We aim to bring you long-term focused analysis driven by fundamental data. Note that our analysis may not factor in the latest price-sensitive company announcements or qualitative material. Simply Wall St has no position in any stocks mentioned.
Have feedback on this article? Concerned about the content? Get in touch with us directly. Alternatively, email editorial-team@simplywallst.com